CWU total enrollment is approximately 11,174 students. 9,235 are undergraduates and 225 are graduate students.
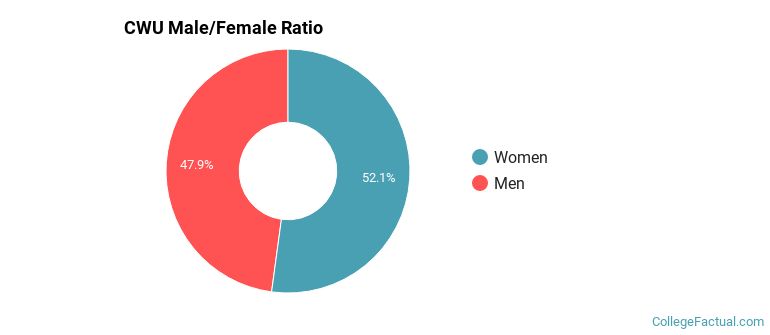
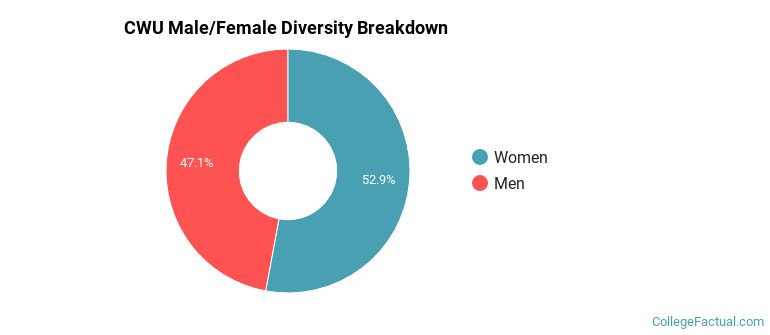
Male/Female Breakdown of Undergraduates
The full-time CWU undergraduate population is made up of 54% women, and 46% men.
For the gender breakdown for all students, go here.
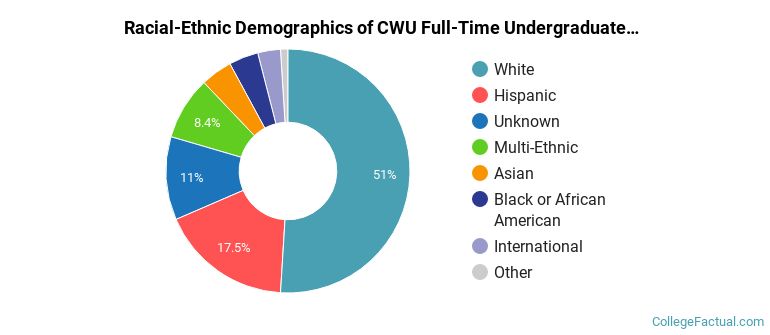
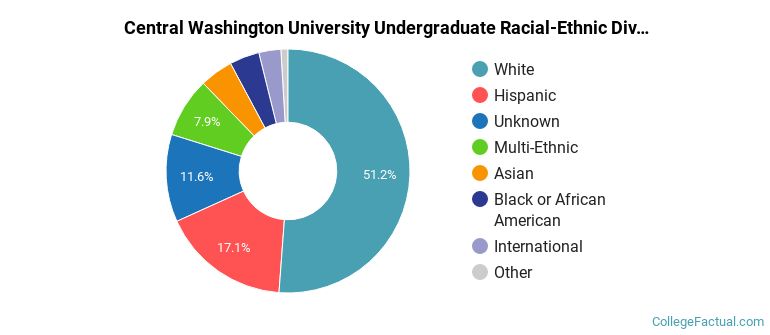
CWU Racial/Ethnic Breakdown of Undergraduates
| Race/Ethnicity | Number |
|---|---|
| White | 4,816 |
| Hispanic | 1,667 |
| Multi-Ethnic | 827 |
| Unknown | 708 |
| Asian | 413 |
| Black or African American | 393 |
| International | 255 |
| Native Hawaiian or Pacific Islander | 96 |
See racial/ethnic breakdown for all students.
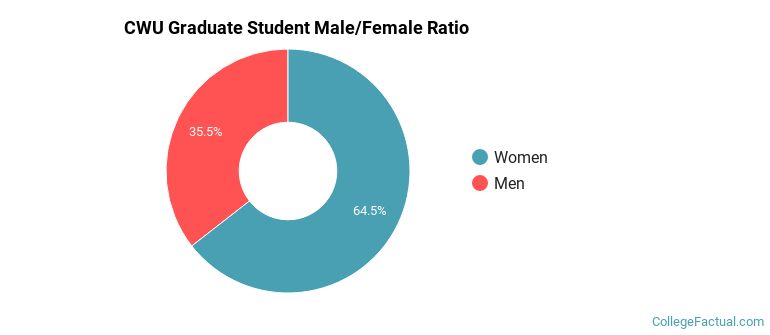
Male/Female Breakdown of Graduate Students
About 59% of full-time grad students are women, and 41% men.
For the gender breakdown for all students, go here.
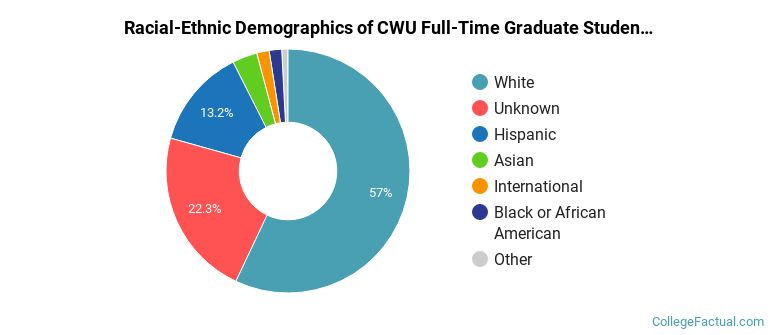
CWU Racial-Ethnic Breakdown of Graduate Students
| Race/Ethnicity | Number |
|---|---|
| Unknown | 94 |
| White | 85 |
| Hispanic | 18 |
| International | 10 |
| Black or African American | 7 |
| Multi-Ethnic | 5 |
| Asian | 4 |
| Native Hawaiian or Pacific Islander | 1 |
See racial/ethnic breakdown for all students.
| Race/Ethnicity | Number |
|---|---|
| White | 5,698 |
| Hispanic | 1,956 |
| Unknown | 1,084 |
| Multi-Ethnic | 955 |
| Asian | 526 |
| Black or African American | 473 |
| International | 301 |
| Native Hawaiian or Pacific Islander | 108 |
There are approximately 6,036 female students and 5,138 male students at CWU.
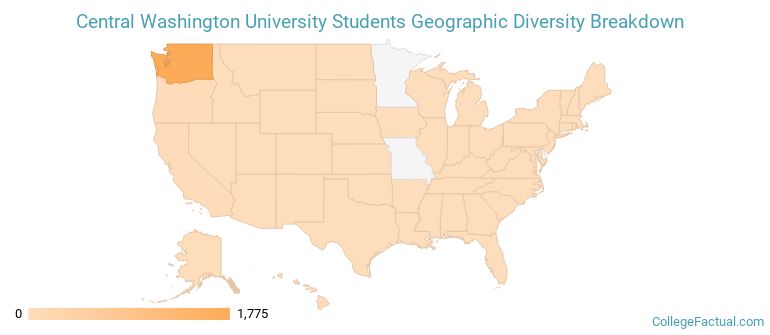
CWU ranks 1,302 out of 2,183 when it comes to geographic diversity.
6.97% of CWU students come from out of state, and 0% come from out of the country.
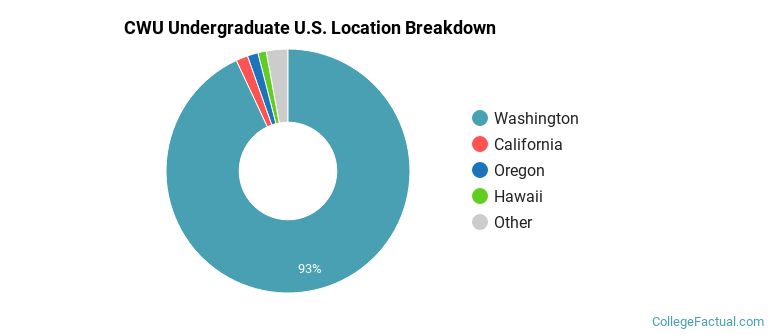
The undergraduate student body is split among 20 states (may include Washington D.C.). Click on the map for more detail.
| State | Amount |
|---|---|
| Washington | 1,775 |
| California | 30 |
| Oregon | 27 |
| Hawaii | 21 |
| Alaska | 13 |
Students from 56 countries are represented at this school, with the majority of the international students coming from Japan, Saudi Arabia, and Vietnam.
Learn more about international students at CWU.
A traditional college student is defined as being between the ages of 18-21. At CWU, 53.39% of students fall into that category, compared to the national average of 60%.
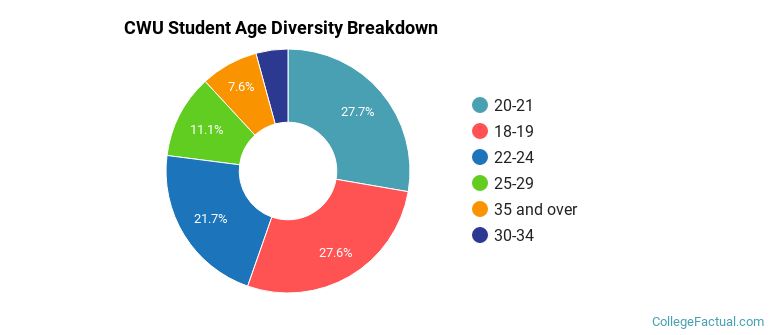
| Student Age Group | Amount |
|---|---|
| 20-21 | 3,448 |
| 18-19 | 3,440 |
| 22-24 | 2,696 |
| 25-29 | 1,380 |
| 35 and over | 950 |
| 30-34 | 528 |
| Under 18 | 0 |
Footnotes
*The racial-ethnic minorities count is calculated by taking the total number of students and subtracting white students, international students, and students whose race/ethnicity was unknown. This number is then divided by the total number of students at the school to obtain the racial-ethnic minorities percentage.
References
Department of Homeland Security Citizenship and Immigration Services
Image Credit: By Bobak Ha’Eri under License
Learn more about how College Factual creates their Diversity Rankings.