Explore the best ranked schools for the programs you are most interested in.
Cerro Coso Community College was not ranked in College Factual's 2025 Best Overall Colleges report. This could be for a number of reasons, including lack of data.
If you are worried about getting into Cerro Coso Community College, don't be. The school has a liberal open admissions policy, which means you only need to meet basic requirements in order to be admitted. Still, be sure to submit a complete application and provide any other requested materials.
The student to faculty ratio at Cerro Coso Community College is 23 to 1, which is high when compared to the national average of 15 to 1. This may indicate that some of your classes will be larger in size than they would be at other schools. However, upper level classes will probably be smaller.
In addition to the student to faculty ratio, some people look at what percentage of faculty members are full-time as a sign of how much time professors will be able to spend with their students. This is because part-time teachers may not be be on campus as much as their full-time counterparts.
The full-time faculty percentage at Cerro Coso Community College is 42%. This is lower than the national average of 47%.
The freshmen retention rate is a measure of what percentage of first-year, full-time students come back for their sophomore year. The 45% rate at Cerro Coso Community College is a good bit lower than the national rate of 68%. This could be for a number of reasons, such as students transferring after a year because they changed majors.
During the 2017-2018 academic year, there were 5,159 undergraduates at Cerro Coso Community College with 905 being full-time and 4,254 being part-time.
The net price is calculated by adding tuition, room, board and other costs and subtracting financial aid.Note that the net price is typically less than the published for a school. For more information on the sticker price of Cerro Coso Community College, see our tuition and fees and room and board pages.
Almost 66% of college students who graduated with the class of 2018 took out student loans, but that percentage varies from school to school. At Cerro Coso Community College, approximately 1% of students took out student loans averaging $9,402 a year. That adds up to $37,608 over four years for those students.
Get more details about paying for Cerro Coso Community College.
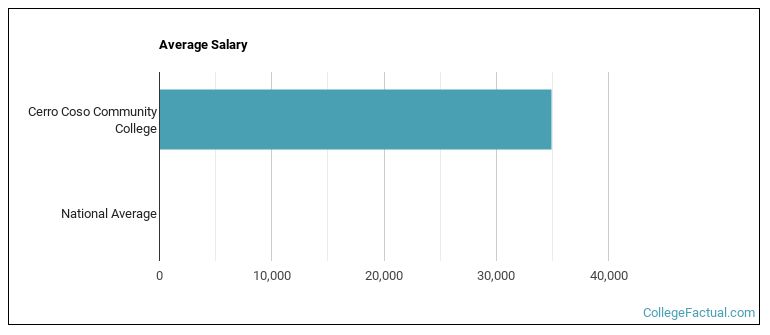
See which majors at Cerro Coso Community College make the most money.
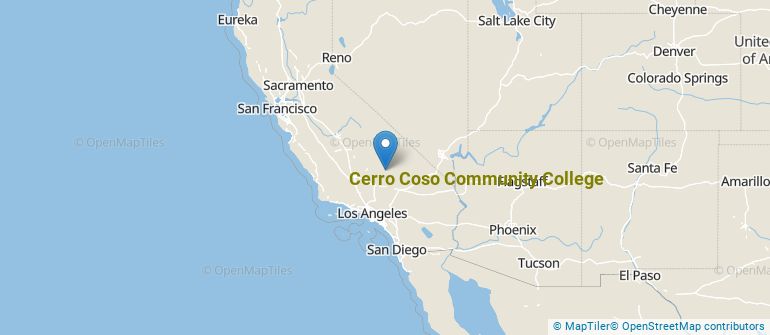
Get more details about the location of Cerro Coso Community College.
Contact details for Cerro Coso Community College are given below.
| Contact Details | |
|---|---|
| Address: | 3000 College Heights Blvd, Ridgecrest, CA 93555-9571 |
| Phone: | 760-384-6100 |
| Website: | https://cerrocoso.edu/ |
| Most Popular Majors | Bachelor’s Degrees | Average Salary of Graduates |
|---|---|---|
| Computer Information Systems | 72 | NA |
| Liberal Arts General Studies | 72 | NA |
| Business Administration & Management | 59 | NA |
| Human Development & Family Studies | 58 | NA |
| General Psychology | 58 | NA |
| Computer Systems Networking | 44 | NA |
| Entrepreneurial Studies | 34 | NA |
| Criminal Justice & Corrections | 34 | NA |
| Legal Support Services | 29 | NA |
| Practical Nursing & Nursing Assistants | 27 | NA |
Online learning options are becoming more and more popular at American colleges and universities. Online classes are great for students who have busy schedules or for those who just want to study on their own time.
In 2022-2023, 3,430 students took at least one online class at Cerro Coso Community College. This is a decrease from the 3,910 students who took online classes the previous year.
| Year | Took at Least One Online Class | Took All Classes Online |
|---|---|---|
| 2022-2023 | 3,430 | 2,590 |
| 2021-2022 | 3,910 | 3,515 |
| 2020-2021 | 2,619 | 1,583 |
| 2018-2019 | 3,032 | 2,074 |
Learn more about online learning at Cerro Coso Community College.
Footnotes
*The racial-ethnic minorities count is calculated by taking the total number of students and subtracting white students, international students, and students whose race/ethnicity was unknown. This number is then divided by the total number of students at the school to obtain the racial-ethnic minorities percentage.
References
More about our data sources and methodologies.