We've gathered data and other essential information about the program, such as the ethnicity of students, how many students graduated in recent times, and more. We've also included details on how Charter College ranks compared to other colleges offering a major in health science.
Go directly to any of the following sections:
The bachelor's program at Charter College was ranked #365 on College Factual's Best Schools for health science list.
The average full-time tuition and fees for undergraduates are shown in the table below.
| In State | Out of State | |
|---|---|---|
| Tuition | $18,075 | $18,075 |
| Books and Supplies | $300 | $300 |
Learn more about Charter College tuition and fees.
Online degrees for the Charter College health science bachelor’s degree program are not available at this time. To see if the school offers distance learning options in other areas, visit the Charter College Online Learning page.
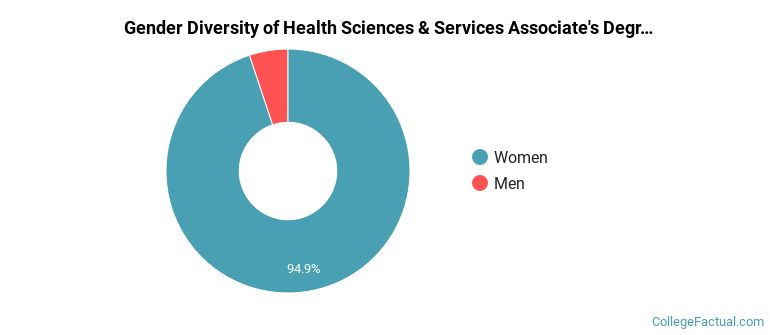
Of the 39 health science students who graduated with a associate's degree in 2021-2022 from Charter College, about 5% were men and 95% were women.
The following table and chart show the ethnic background for students who recently graduated from Charter College with a associate's in health science.

| Ethnic Background | Number of Students |
|---|---|
| Asian | 0 |
| Black or African American | 2 |
| Hispanic or Latino | 7 |
| White | 19 |
| Non-Resident Aliens | 0 |
| Other Races | 11 |
| Related Major | Annual Graduates |
|---|---|
| Allied Health & Medical Assisting Services | 583 |
| Health & Medical Administrative Services | 117 |
| Dental Support Services | 113 |
| Nursing | 59 |
| Clinical/Medical Laboratory Science | 36 |