We’ve pulled together the essential facts you should know about the program at CVTC. You can study it at the Associate’s level. Jump to any of the following sections:
The table below lists every degree level offered in legal support services at CVTC, along with how many graduates complete each level annually.
| Degree Level | Annual Graduates |
|---|---|
| Associate’s | 12 |
During the most recent reporting year, Chippewa Valley Technical College conferred 12 associate’s degrees in legal support services.
CVTC is not yet ranked for legal support services at the associate’s level.
Information about average full-time undergraduate tuition and fees is shown in the table below.
| In State | Out of State | |
|---|---|---|
| Tuition | $4,230 | $6,728 |
| Fees | $359 | $359 |
Learn more about CVTC tuition and fees.
Every one of the 12 students who graduated with a associate’s degree in legal support services from CVTC were women.
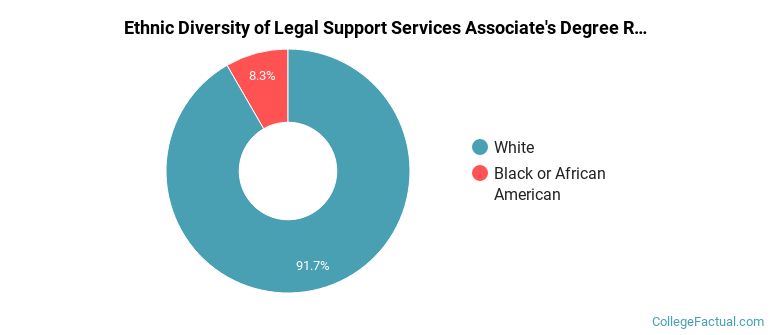
 The largest share of legal support services associate’s degree graduates at CVTC were White. Approximately 92% of graduates fell into this category.
The following table and chart show the ethnic background for students who recently graduated from Chippewa Valley Technical College with a associate’s in legal support services.
| Ethnic Background | Number of Students |
|---|---|
| Asian | 0 |
| Black or African American | 1 |
| Hispanic or Latino | 0 |
| White | 11 |
| Non-Resident Aliens | 0 |
| Other Races | 0 |
CVTC conferred 12 associate’s completions in legal assistant/paralegal recently — 100% to women and 0% to men. Most of these graduates identified as White (92%).
More about our data sources and methodologies.