We've gathered data and other essential information about the program, such as the ethnicity of students, how many students graduated in recent times, and more. Also, learn how Cincinnati State ranks among other schools offering degrees in me tech.
Go directly to any of the following sections:
Cincinnati State is in the top 10% of the country for me tech. More specifically it was ranked #6 out of 77 schools by College Factual.
During the 2022-2023 academic year, part-time undergraduate students at Cincinnati State paid an average of $367 per credit hour if they came to the school from out-of-state. In-state students paid a discounted rate of $184 per credit hour. The average full-time tuition and fees for undergraduates are shown in the table below.
| In State | Out of State | |
|---|---|---|
| Tuition | $4,410 | $8,811 |
| Fees | $990 | $990 |
| Books and Supplies | $2,169 | $2,169 |
Learn more about Cincinnati State tuition and fees.
Online degrees for the Cincinnati State me tech bachelor’s degree program are not available at this time. To see if the school offers distance learning options in other areas, visit the Cincinnati State Online Learning page.
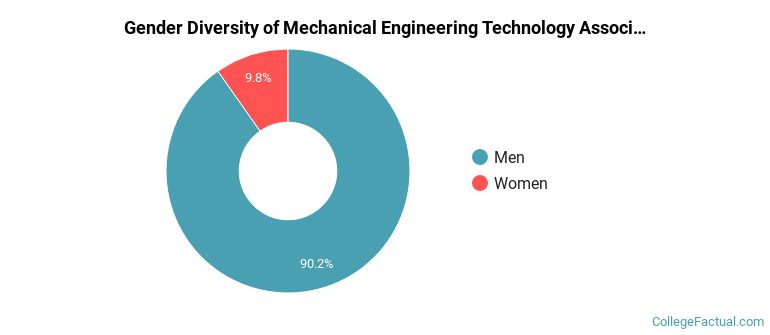
During the 2021-2022 academic year, 41 students graduated with a associate's degree in me tech from Cincinnati State. About 90% were men and 10% were women.
The majority of associate's degree recipients in this major at Cincinnati State are white. In the most recent graduating class for which data is available, 83% of students fell into this category.
The following table and chart show the ethnic background for students who recently graduated from Cincinnati State Technical and Community College with a associate's in me tech.
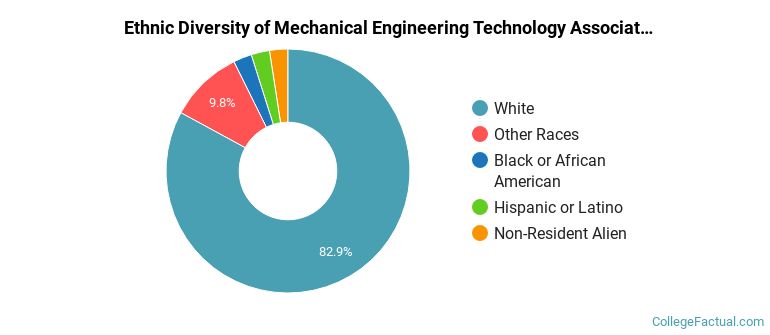
| Ethnic Background | Number of Students |
|---|---|
| Asian | 0 |
| Black or African American | 1 |
| Hispanic or Latino | 1 |
| White | 34 |
| Non-Resident Aliens | 1 |
| Other Races | 4 |
| Related Major | Annual Graduates |
|---|---|
| Electromechanical Engineering Technology | 37 |
| Civil Engineering Technology | 34 |
| Computer Engineering Technology | 34 |
| Industrial Production Technology | 26 |
| Engineering-Related Technologies | 23 |