Jump to any of the following sections:
The bachelor's program at Olive-Harvey College was ranked #585 on College Factual's Best Schools for liberal arts / sciences & humanities list.
Learn about other programs related to Liberal Arts / Sciences & Humanities that might interest you.
Maximize your transfer credits and complete your bachelor's degree faster with this flexible online bachelor's from Southern New Hampshire University.
Out-of-state part-time undergraduates at Olive-Harvey College paid an average of $481 per credit hour in 2022-2023. The average for in-state students was $384 per credit hour. Information about average full-time undergraduate tuition and fees is shown in the table below.
| In State | Out of State | |
|---|---|---|
| Tuition | $11,520 | $14,430 |
| Books and Supplies | $1,920 | $1,920 |
Learn more about Olive-Harvey College tuition and fees.
Olive-Harvey College does not offer an online option for its liberal arts / sciences & humanities bachelor’s degree program at this time. To see if the school offers distance learning options in other areas, visit the Olive-Harvey College Online Learning page.
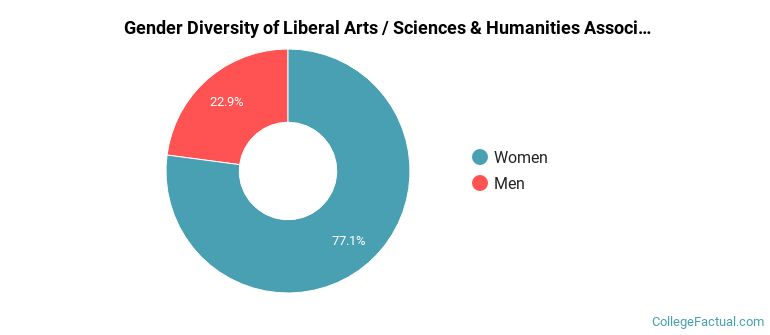
In the 2021-2022 academic year, 96 students earned a associate's degree in liberal arts / sciences & humanities from Olive-Harvey College. About 77% of these graduates were women and the other 23% were men.
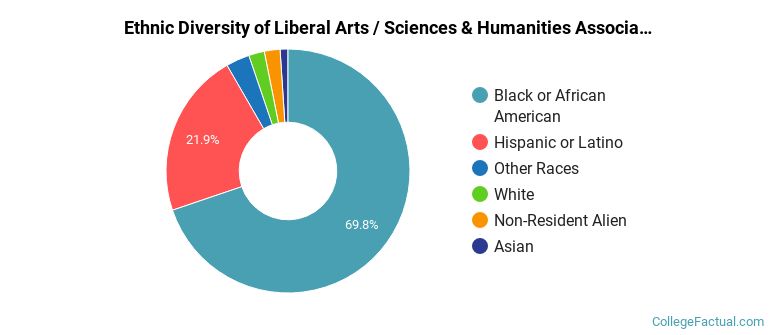
The majority of the associate's degree graduates for this major are black or African Americans. About 70% of grads fell into this category.
The following table and chart show the ethnic background for students who recently graduated from City Colleges of Chicago - Olive-Harvey College with a associate's in liberal arts / sciences & humanities.
| Ethnic Background | Number of Students |
|---|---|
| Asian | 1 |
| Black or African American | 67 |
| Hispanic or Latino | 21 |
| White | 2 |
| Non-Resident Aliens | 2 |
| Other Races | 3 |
Liberal Arts / Sciences & Humanities students may decide to major in one of the following focus areas. Individual majors may not be available for all degree levels.
| Major | Annual Graduates |
|---|---|
| Liberal Arts General Studies | 144 |
| Related Major | Annual Graduates |
|---|---|
| Family, Consumer & Human Sciences | 23 |
View All Liberal Arts / Sciences & Humanities Related Majors >
