College Factual recognizes the best colleges and universities in its annual rankings. These rankings include categories for best overall colleges, best colleges for each major, best value schools, and much more.
Cleary University was awarded 2 badges in the 2025 rankings. The highest ranked major at the school is general business administration and management.
Explore the best ranked schools for the programs you are most interested in.
Cleary College was not ranked in College Factual's 2025 Best Overall Colleges report. This could be for a number of reasons, including lack of data.
The acceptance rate at Cleary University is a competitive 68%, so make sure you take your application seriously when putting it together. Even leaving out a minor detail could be a reason to move you to the rejection pile.
The student to faculty ratio is often used to estimate how much interaction there is between professors and their students at a college or university. At Cleary University, this ratio is 13 to 1, which is on par with the national average of 15 to 1. That's not bad at all.
In addition to the student to faculty ratio, some people look at what percentage of faculty members are full-time as a sign of how much time professors will be able to spend with their students. This is because part-time teachers may not be be on campus as much as their full-time counterparts.
The full-time faculty percentage at Cleary University is 7%. This is lower than the national average of 47%.
The freshmen retention rate is a sign of how many full-time students like a college or university well enough to come back for their sophomore year. At Cleary University this rate is 52%, which is a bit lower than the national average of 68%.
When we say that a student has graduated on time, we mean that they have finished their bachelor's degree within four years. The on-time graduation rate at Cleary College is 4%. That's lower than the national rate of 33.3%
Find out more about the retention and graduation rates at Cleary University.
During the 2017-2018 academic year, there were 509 undergraduates at Cleary College with 392 being full-time and 117 being part-time.
| $0-30 K | $30K-48K | $48-75 | $75-110K | $110K + |
|---|---|---|---|---|
| $32,192 | $31,590 | $33,265 | $31,235 | $33,706 |
The net price is calculated by adding tuition, room, board and other costs and subtracting financial aid.Note that the net price is typically less than the published for a school. For more information on the sticker price of Cleary College, see our tuition and fees and room and board pages.
Almost 66% of college students who graduated with the class of 2018 took out student loans, but that percentage varies from school to school. At Cleary College, approximately 59% of students took out student loans averaging $4,359 a year. That adds up to $17,436 over four years for those students.
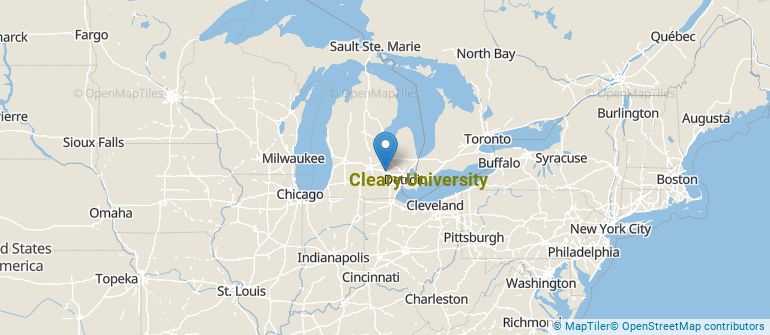
Get more details about the location of Cleary University.
Contact details for Cleary College are given below.
| Contact Details | |
|---|---|
| Address: | 3750 Cleary Drive, Howell, MI 48843 |
| Phone: | 800-686-1883 |
| Website: | www.cleary.edu/ |
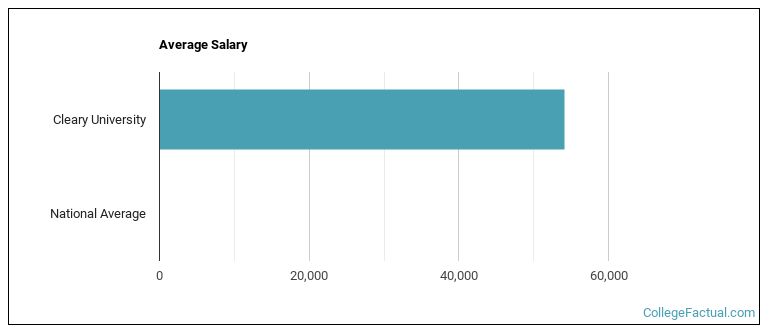
| Most Popular Majors | Bachelor’s Degrees | Average Salary of Graduates |
|---|---|---|
| Business Administration & Management | 151 | $50,573 |
| Accounting | 8 | $43,665 |
| Finance & Financial Management | 8 | NA |
| Hospitality Management | 3 | NA |
| Human Resource Management | 1 | NA |
Online learning options are becoming more and more popular at American colleges and universities. Online classes are great for students who have busy schedules or for those who just want to study on their own time.
In 2022-2023, 888 students took at least one online class at Cleary University. This is an increase from the 751 students who took online classes the previous year.
| Year | Took at Least One Online Class | Took All Classes Online |
|---|---|---|
| 2022-2023 | 888 | 278 |
| 2021-2022 | 751 | 310 |
| 2020-2021 | 658 | 282 |
| 2018-2019 | 277 | 165 |
Footnotes
*The racial-ethnic minorities count is calculated by taking the total number of students and subtracting white students, international students, and students whose race/ethnicity was unknown. This number is then divided by the total number of students at the school to obtain the racial-ethnic minorities percentage.
References
More about our data sources and methodologies.