
In its yearly rankings, College Factual analyzes over 2,000 colleges and universities to determine which ones are the best in a variety of categories, such as overall value, quality, diversity, which schools are the best for each major, and much more.
Clover Park Technical College was awarded 12 badges in the 2025 rankings. The highest ranked major at the school is personal & culinary services.
Explore the best ranked schools for the programs you are most interested in.
College Factual ranked CPTC as #596 out of 2,152 colleges and universities in the country on its 2025 Best Colleges list.
Out of the 50 colleges in Washington, CPTC is ranked at #10.
Since Clover Park Technical College has an open admissions policy, being accepted to the school isn't that hard. However, a full basic things - such as a high school diploma or equivalent - may be required. Also, go over your application to make sure it is complete before you submit it.
At Clover Park Technical College, the student to faculty ratio is 19 to 1. Compared to the national average of 15 to 1, this is somewhat high. This could mean that class sizes may be larger than they are at other colleges or universities or that professors may be required to teach more classes.
When estimating how much access students will have to their teachers, some people like to look at what percentage of faculty members are full time. This is because part-time teachers may not have as much time to spend on campus as their full-time counterparts.
The full-time faculty percentage at Clover Park Technical College is 98%. This is higher than the national average of 47%.
During the 2017-2018 academic year, there were 3,591 undergraduates at CPTC with 1,962 being full-time and 1,629 being part-time.
The net price is calculated by adding tuition, room, board and other costs and subtracting financial aid.Note that the net price is typically less than the published for a school. For more information on the sticker price of CPTC, see our tuition and fees and room and board pages.
While almost two-thirds of students nationwide take out loans to pay for college, the percentage may be quite different for the school you plan on attending. At CPTC, approximately 11% of students took out student loans averaging $5,604 a year. That adds up to $22,416 over four years for those students.
Get more details about paying for Clover Park Technical College.
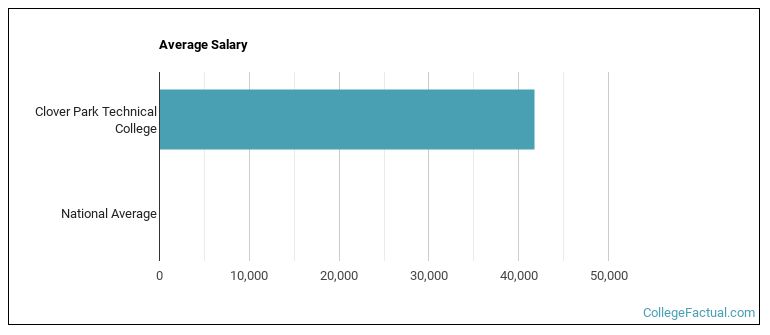
See which majors at Clover Park Technical College make the most money.
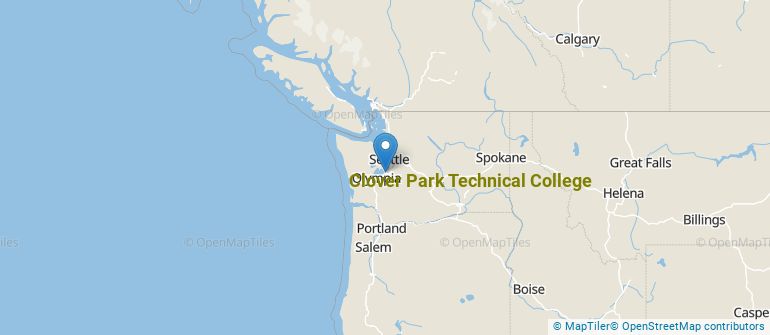
Get more details about the location of Clover Park Technical College.
Contact details for CPTC are given below.
| Contact Details | |
|---|---|
| Address: | 4500 Steilacoom Blvd Sw, Lakewood, WA 98499-4004 |
| Phone: | 253-589-5800 |
| Website: | www.cptc.edu/ |
| Most Popular Majors | Bachelor’s Degrees | Average Salary of Graduates |
|---|---|---|
| Information Technology | 330 | NA |
| Vehicle Maintenance & Repair | 244 | NA |
| Precision Metal Working | 126 | NA |
| Heating, Air Conditioning, Ventilation & Refrigeration | 116 | NA |
| Practical Nursing & Nursing Assistants | 111 | NA |
| Building Management & Inspection | 55 | NA |
| Cosmetology | 46 | NA |
| Teacher Education Grade Specific | 43 | NA |
| Business Administration & Management | 42 | NA |
| Clinical/Medical Laboratory Science | 42 | NA |
Online courses area a great option for busy, working students as well as for those who have scheduling conflicts and want to study on their own time. As time goes by, expect to see more and more online learning options become available.
In 2022-2023, 884 students took at least one online class at Clover Park Technical College. This is a decrease from the 1,230 students who took online classes the previous year.
| Year | Took at Least One Online Class | Took All Classes Online |
|---|---|---|
| 2022-2023 | 884 | 319 |
| 2021-2022 | 1,230 | 529 |
| 2020-2021 | 1,272 | 634 |
| 2018-2019 | 859 | 222 |
Learn more about online learning at Clover Park Technical College.
Footnotes
*The racial-ethnic minorities count is calculated by taking the total number of students and subtracting white students, international students, and students whose race/ethnicity was unknown. This number is then divided by the total number of students at the school to obtain the racial-ethnic minorities percentage.
References
More about our data sources and methodologies.