We've gathered data and other essential information about the program, such as the ethnicity of students, how many students graduated in recent times, and more. We've also included details on how College of Lake County ranks compared to other colleges offering a major in biological science.
Go directly to any of the following sections:
The bachelor's program at College of Lake County was ranked #41 on College Factual's Best Schools for biological science list.
During the 2022-2023 academic year, part-time undergraduate students at College of Lake County paid an average of $478 per credit hour if they came to the school from out-of-state. In-state students paid a discounted rate of $353 per credit hour. The following table shows the average full-time tuition and fees for undergraduates.
| In State | Out of State | |
|---|---|---|
| Tuition | $9,872 | $13,377 |
| Fees | $659 | $659 |
| Books and Supplies | $1,260 | $1,260 |
Learn more about College of Lake County tuition and fees.
College of Lake County does not offer an online option for its biological science bachelor’s degree program at this time. To see if the school offers distance learning options in other areas, visit the College of Lake County Online Learning page.
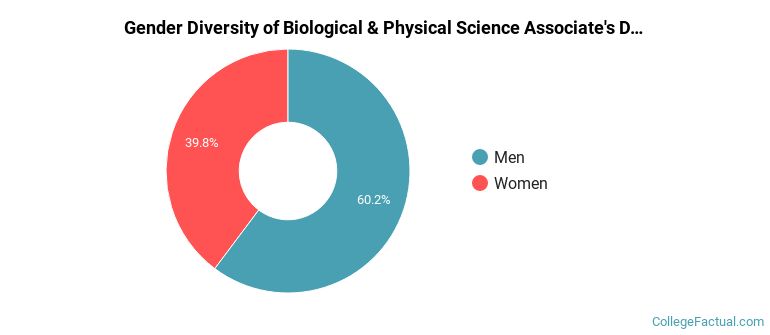
In the 2021-2022 academic year, 166 students earned a associate's degree in biological science from College of Lake County. About 40% of these graduates were women and the other 60% were men.
The following table and chart show the ethnic background for students who recently graduated from College of Lake County with a associate's in biological science.
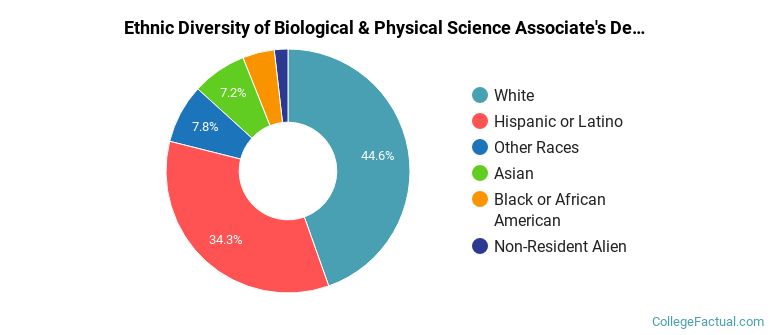
| Ethnic Background | Number of Students |
|---|---|
| Asian | 12 |
| Black or African American | 7 |
| Hispanic or Latino | 57 |
| White | 74 |
| Non-Resident Aliens | 3 |
| Other Races | 13 |