Below are the key facts about this program at College of Lake County. You can study it at the Associate’s, Undergraduate Certificate, Certificate levels. Jump to any of the following sections:
The following degree levels are granted in precision metal working at College of Lake County, along with how many graduates complete each level annually.Degree Level Annual Graduates Associate’s 11 Undergraduate Certificate 4 Certificate 109
For the most recent IPEDS reporting year, College of Lake County handed out 11 associate’s degrees in precision metal working.
College of Lake County has not been ranked for precision metal working at the associate’s level.
The full-time undergraduate tuition and fees are shown below.In State Out of State Tuition $9,016 $13,475 Fees $925 $925
Learn more about College of Lake County tuition and fees.
For the most recent academic year available, 91% of precision metal working associate’s degrees went to men and 9% went to women.
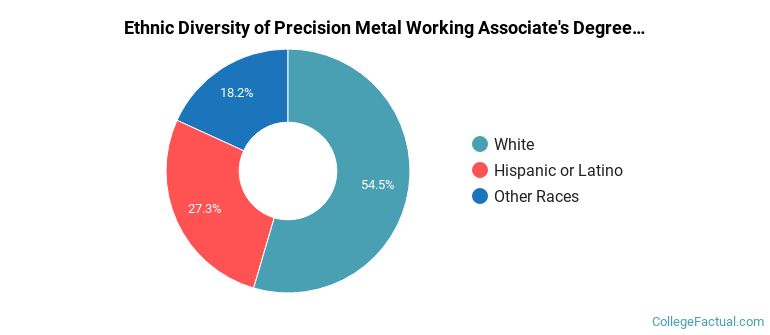
 The largest share of precision metal working associate’s degree graduates at College of Lake County are White. About 55% of graduates fell into this category.
The following table and chart show the ethnic background for students who recently graduated from College of Lake County with a associate’s in precision metal working.
| Ethnic Background | Number of Students |
|---|---|
| Asian | 0 |
| Black or African American | 0 |
| Hispanic or Latino | 3 |
| White | 6 |
| Non-Resident Aliens | 0 |
| Other Races | 2 |
College of Lake County awarded 5 associate’s degrees in welding technology/welder in the latest year of data — 20% to women and 80% to men. The most common background among these graduates was White (60%).
College of Lake County conferred 3 associate’s degrees in computer numerically controlled (cnc) machinist technology/cnc machinist in the most recent reporting year — 0% to women and 100% to men. The most common background among these graduates was White (100%).
College of Lake County conferred 3 associate’s degrees in machine tool technology/machinist in the most recent reporting year — 0% to women and 100% to men. Most of these graduates identified as Hispanic or Latino (67%).
In the most recent year for which we have data, College of Lake County conferred 4 undergraduate certificate degrees in precision metal working.
College of Lake County is not currently ranked for precision metal working at the undergraduate certificate level.
In the most recent graduating class, 75% of precision metal working undergraduate certificate degrees went to men and 25% went to women.
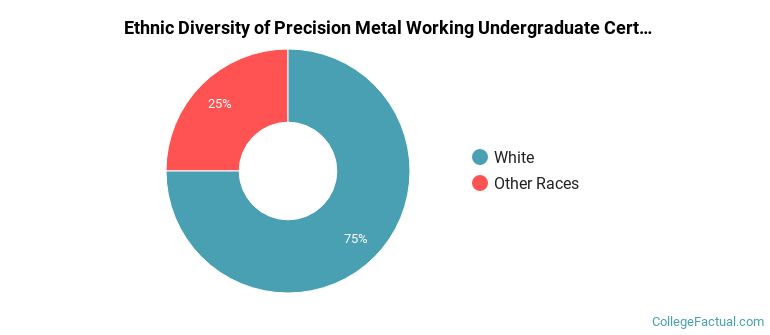
 The majority of precision metal working undergraduate certificate degree graduates at College of Lake County were White. About 75% of graduates fell into this category.
The following table and chart show the ethnic background for students who recently graduated from College of Lake County with a undergraduate certificate in precision metal working.
| Ethnic Background | Number of Students |
|---|---|
| Asian | 0 |
| Black or African American | 0 |
| Hispanic or Latino | 0 |
| White | 3 |
| Non-Resident Aliens | 0 |
| Other Races | 1 |
College of Lake County awarded 4 undergraduate certificate degrees in welding technology/welder in the latest year of data — 25% to women and 75% to men. The largest share of these graduates were White (75%).
For the most recent IPEDS reporting year, College of Lake County conferred 109 certificate degrees in precision metal working.
College of Lake County has not been ranked for precision metal working at the certificate level.
In the most recent graduating class, 92% of precision metal working certificate degrees went to men and 8% went to women.
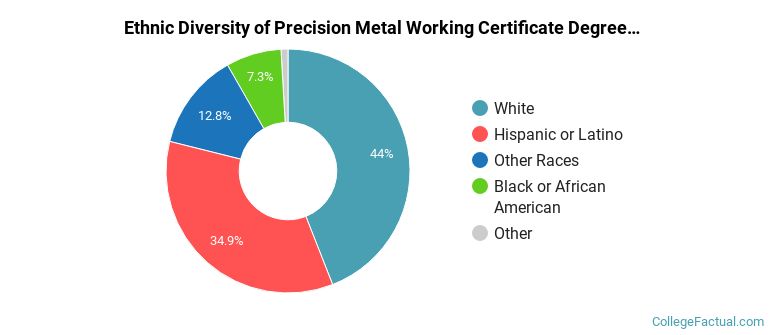
 The majority of precision metal working certificate degree graduates at College of Lake County were White. About 44% of graduates fell into this category.
The following table and chart show the ethnic background for students who recently graduated from College of Lake County with a certificate in precision metal working.
| Ethnic Background | Number of Students |
|---|---|
| Asian | 0 |
| Black or African American | 8 |
| Hispanic or Latino | 38 |
| White | 48 |
| Non-Resident Aliens | 1 |
| Other Races | 14 |
College of Lake County conferred 109 certificate degrees in welding technology/welder recently — 8% to women and 92% to men. Most of these graduates identified as White (44%).
More about our data sources and methodologies.