Go directly to any of the following sections:
The visual & performing arts major at CSM is not ranked on College Factual’s Best Colleges and Universities for Visual & Performing Arts. This could be for a number of reasons, such as not having enough data on the major or school to make an accurate assessment of its quality.
During the 2022-2023 academic year, part-time undergraduate students at CSM paid an average of $315 per credit hour if they came to the school from out-of-state. In-state students paid a discounted rate of $245 per credit hour. The following table shows the average full-time tuition and fees for undergraduates.
| In State | Out of State | |
|---|---|---|
| Tuition | $5,880 | $7,560 |
| Fees | $1,470 | $1,890 |
| Books and Supplies | $1,000 | $1,000 |
Learn more about CSM tuition and fees.
CSM does not offer an online option for its visual & performing arts bachelor’s degree program at this time. To see if the school offers distance learning options in other areas, visit the CSM Online Learning page.
All of the 2 students who graduated with a Associate’s in visual & performing arts from CSM in 2022 were women.

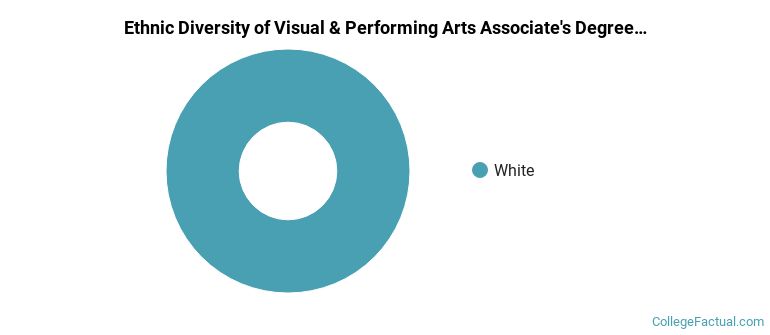
The majority of the students with this major are white. About 100% of 2022 graduates were in this category.
The following table and chart show the ethnic background for students who recently graduated from College of Southern Maryland with a associate's in visual & performing arts.
| Ethnic Background | Number of Students |
|---|---|
| Asian | 0 |
| Black or African American | 0 |
| Hispanic or Latino | 0 |
| White | 2 |
| Non-Resident Aliens | 0 |
| Other Races | 0 |
Visual & Performing Arts students may decide to major in one of the following focus areas. Individual majors may not be available for all degree levels.
| Major | Annual Graduates |
|---|---|
| Design & Applied Arts | 13 |
| Film, Video & Photographic Arts | 2 |