We've gathered data and other essential information about the program, such as the ethnicity of students, how many students graduated in recent times, and more. In addition, we cover how CCAC ranks in comparison to other schools with medical assisting programs.
Jump to any of the following sections:
The bachelor's program at CCAC was ranked #123 on College Factual's Best Schools for medical assisting list.
In 2022-2023, the average part-time undergraduate tuition at CCAC was $378 per credit hour for out-of-state students. The average for in-state students was $252 per credit hour. The following table shows the average full-time tuition and fees for undergraduates.
| In State | Out of State | |
|---|---|---|
| Tuition | $7,560 | $11,340 |
| Fees | $1,243 | $1,243 |
| Books and Supplies | $1,500 | $1,500 |
Learn more about CCAC tuition and fees.
CCAC does not offer an online option for its medical assisting bachelor’s degree program at this time. To see if the school offers distance learning options in other areas, visit the CCAC Online Learning page.
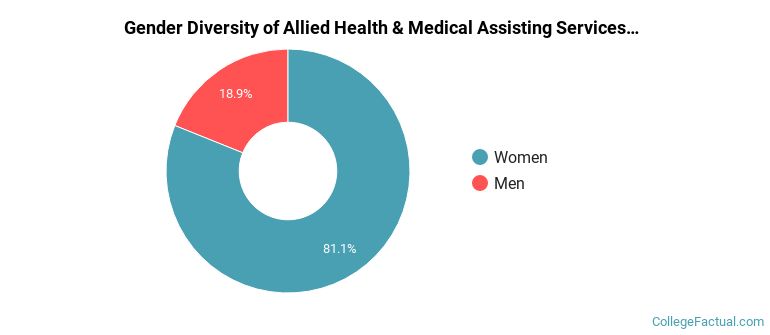
Of the 37 students who earned an associate's degree in Allied Health & Medical Assisting Services from CCAC in 2021-2022, 19% were men and 81% were women.
The majority of associate's degree recipients in this major at CCAC are white. In the most recent graduating class for which data is available, 81% of students fell into this category.
The following table and chart show the ethnic background for students who recently graduated from Community College of Allegheny County with a associate's in medical assisting.
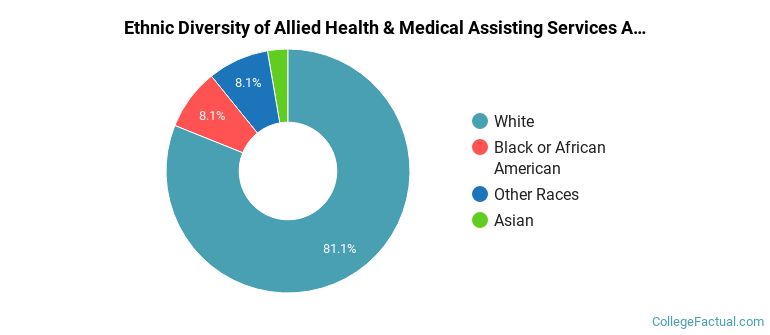
| Ethnic Background | Number of Students |
|---|---|
| Asian | 1 |
| Black or African American | 3 |
| Hispanic or Latino | 0 |
| White | 30 |
| Non-Resident Aliens | 0 |
| Other Races | 3 |
| Related Major | Annual Graduates |
|---|---|
| Nursing | 330 |
| Allied Health Professions | 151 |
| Clinical/Medical Laboratory Science | 41 |
| Health & Medical Administrative Services | 26 |
| Mental & Social Health Services | 23 |
View All Allied Health & Medical Assisting Services Related Majors >