Here, you'll find out more about the major, including such details as the number of graduates, what degree levels are offered, ethnicity of students, average salaries, and more. We've also included details on how Conn College ranks compared to other colleges offering a major in area studies.
Jump to any of the following sections:
Learn about start dates, transferring credits, availability of financial aid, and more by contacting the universities below.
Explore societal similarities and differences as seen through cultural, biological, archaeological and linguistic lenses when you earn one of your degrees in anthropology from Southern New Hampshire University.
The bachelor's program at Conn College was ranked #28 on College Factual's Best Schools for area studies list. It is also ranked #2 in Connecticut.
| Ranking Type | Rank |
|---|---|
| Best Area Studies Bachelor’s Degree Schools | 27 |
| Best Area Studies Schools | 28 |
During the 2021-2022 academic year, Connecticut College handed out 19 bachelor's degrees in area studies. This is a decrease of 30% over the previous year when 27 degrees were handed out.
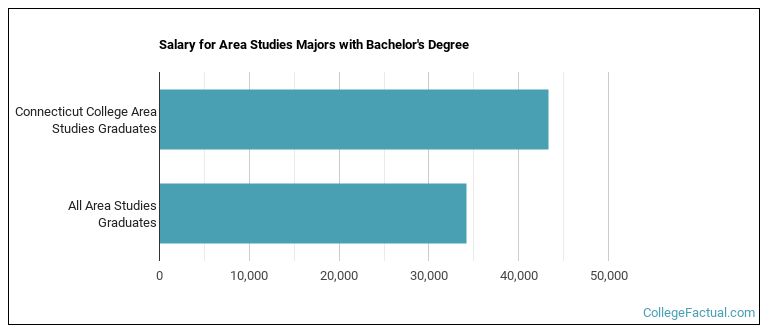
Area Studies majors who earn their bachelor's degree from Conn College go on to jobs where they make a median salary of $43,358 a year. This is higher than $34,211, which is the national median for all area studies bachelor's degree recipients.
In 2022-2023, the average part-time undergraduate tuition at Conn College was $2,019 per credit hour for both in-state and out-of-state students. Information about average full-time undergraduate tuition and fees is shown in the table below.
| In State | Out of State | |
|---|---|---|
| Tuition | $64,412 | $64,412 |
| Fees | $400 | $400 |
| Books and Supplies | $1,000 | $1,000 |
| On Campus Room and Board | $17,885 | $17,885 |
| On Campus Other Expenses | $1,000 | $1,000 |
Learn more about Conn College tuition and fees.
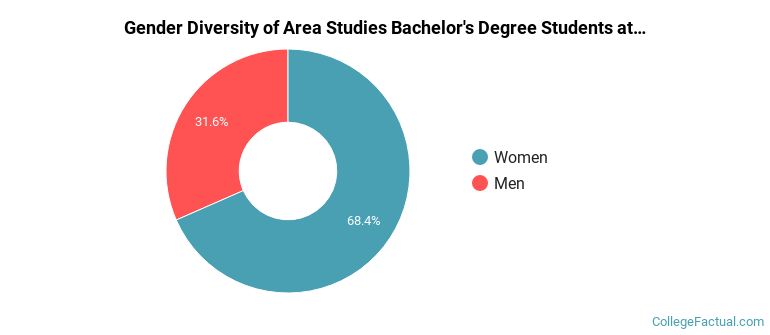
Of the 19 students who graduated with a Bachelor’s in area studies from Conn College in 2022, 32% were men and 68% were women.
The majority of the students with this major are white. About 68% of 2022 graduates were in this category.
The following table and chart show the ethnic background for students who recently graduated from Connecticut College with a bachelor's in area studies.
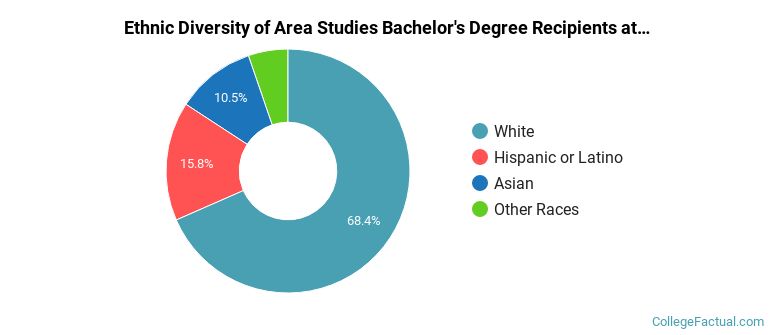
| Ethnic Background | Number of Students |
|---|---|
| Asian | 2 |
| Black or African American | 0 |
| Hispanic or Latino | 3 |
| White | 13 |
| Non-Resident Aliens | 0 |
| Other Races | 1 |
Conn College does not offer an online option for its area studies bachelor’s degree program at this time. To see if the school offers distance learning options in other areas, visit the Conn College Online Learning page.
Take a look at the following statistics related to the make-up of the area studies majors at Connecticut College.
| Related Major | Annual Graduates |
|---|---|
| Ethnic Studies | 8 |
More about our data sources and methodologies.
