Here is an overview of this program at Cosumnes River. Degrees are awarded at the Associate’s, Certificate levels. Jump to any of the following sections:
The table below lists every degree level available for film, video & photographic arts at Cosumnes River, along with how many graduates complete each level annually.Degree Level Annual Graduates Associate’s 14 Certificate 1
For the most recent IPEDS reporting year, Cosumnes River College handed out 14 associate’s degrees in film, video & photographic arts.
Cosumnes River is not yet ranked for film, video & photographic arts at the associate’s level.
Information about average full-time undergraduate tuition and fees is shown in the table below.In State Out of State Tuition $1,288 $11,328 Fees $1,288 $1,288
Find out more about Cosumnes River tuition and fees.
For the most recent academic year available, 64% of film, video & photographic arts associate’s degrees went to men and 36% went to women.
 The majority of film, video & photographic arts associate’s degree graduates at Cosumnes River were White. About 43% of graduates fell into this category.
The following table and chart show the ethnic background for students who recently graduated from Cosumnes River College with a associate’s in film, video & photographic arts.
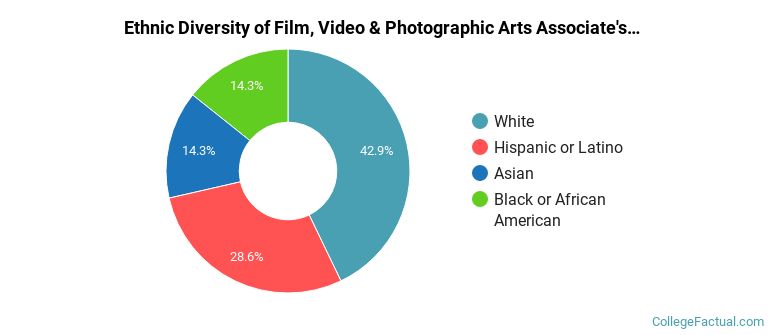
| Ethnic Background | Number of Students |
|---|---|
| Asian | 2 |
| Black or African American | 2 |
| Hispanic or Latino | 4 |
| White | 6 |
| Non-Resident Aliens | 0 |
| Other Races | 0 |
Cosumnes River conferred 8 associate’s degrees in film/cinema/media studies recently — 38% to women and 62% to men. The largest share of these graduates were White (38%).
Cosumnes River granted 6 associate’s degrees in cinematography and film/video production recently — 33% to women and 67% to men. The most common background among these graduates was White (50%).
For the most recent IPEDS reporting year, Cosumnes River College awarded 1 certificate degree in film, video & photographic arts.
Cosumnes River is not currently ranked for film, video & photographic arts at the certificate level.
All of the 1 student who graduated with a certificate degree in film, video & photographic arts from Cosumnes River were men.
 The majority of film, video & photographic arts certificate degree graduates at Cosumnes River are Hispanic or Latino. Roughly 100% of graduates fell into this category.
The following table and chart show the ethnic background for students who recently graduated from Cosumnes River College with a certificate in film, video & photographic arts.
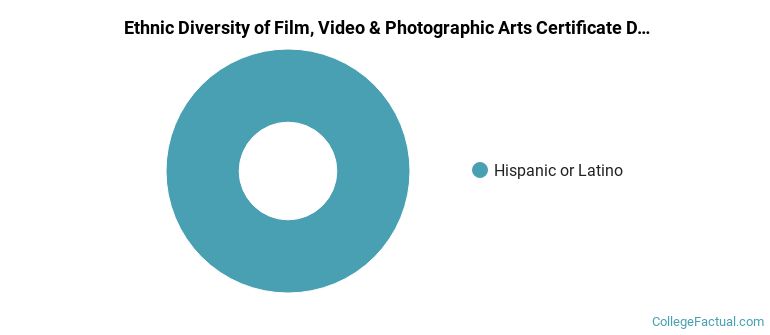
| Ethnic Background | Number of Students |
|---|---|
| Asian | 0 |
| Black or African American | 0 |
| Hispanic or Latino | 1 |
| White | 0 |
| Non-Resident Aliens | 0 |
| Other Races | 0 |
Cosumnes River granted 1 certificate completion in photography in the latest year of data — 0% to women and 100% to men. The most common background among these graduates was Hispanic or Latino (100%).
More about our data sources and methodologies.