We've gathered data and other essential information about the program, such as the average salary of graduates, ethnicity of students, how many students graduated in recent times, and more. In addition, we cover how Baruch ranks in comparison to other schools with public admin programs.
Go directly to any of the following sections:
Baruch is in the top 10% of the country for public admin. More specifically it was ranked #13 out of 190 schools by College Factual. It is also ranked #4 in New York.
During the 2021-2022 academic year, Baruch College handed out 38 bachelor's degrees in public administration. This is a decrease of 16% over the previous year when 45 degrees were handed out.
In 2022, 163 students received their master’s degree in public admin from Baruch. This makes it the #10 most popular school for public admin master’s degree candidates in the country.
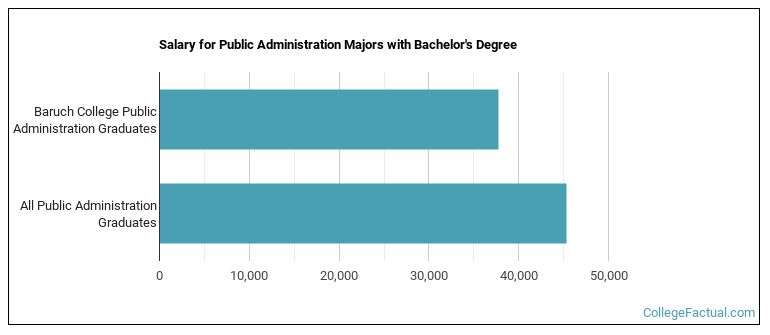
Public Admin majors who earn their bachelor's degree from Baruch go on to jobs where they make a median salary of $37,792 a year. Unfortunately, this is lower than the national average of $45,278 for all public admin students.
In 2022-2023, the average part-time undergraduate tuition at Baruch was $620 per credit hour for out-of-state students. The average for in-state students was $305 per credit hour. Information about average full-time undergraduate tuition and fees is shown in the table below.
| In State | Out of State | |
|---|---|---|
| Tuition | $6,930 | $14,880 |
| Fees | $534 | $534 |
| Books and Supplies | $1,500 | $1,500 |
| On Campus Room and Board | $18,684 | $18,684 |
| On Campus Other Expenses | $3,834 | $3,834 |
Learn more about Baruch tuition and fees.
Of the 38 students who earned a bachelor's degree in Public Administration from Baruch in 2021-2022, 34% were men and 66% were women.

The following table and chart show the ethnic background for students who recently graduated from Baruch College with a bachelor's in public admin.
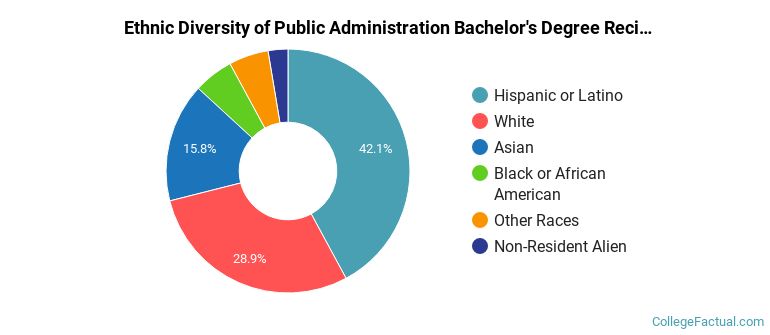
| Ethnic Background | Number of Students |
|---|---|
| Asian | 6 |
| Black or African American | 2 |
| Hispanic or Latino | 16 |
| White | 11 |
| Non-Resident Aliens | 1 |
| Other Races | 2 |
Baruch does not offer an online option for its public admin bachelor’s degree program at this time. To see if the school offers distance learning options in other areas, visit the Baruch Online Learning page.
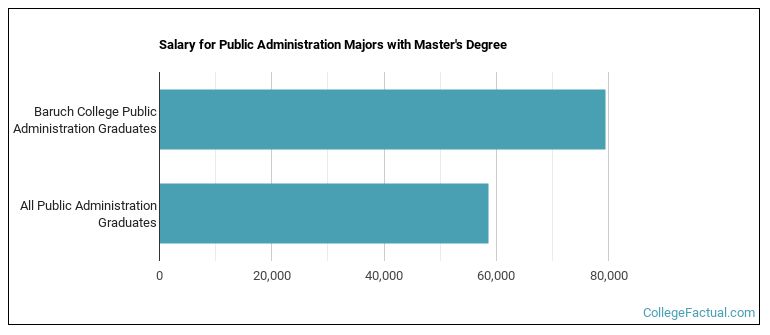
Public Admin majors graduating with a master's degree from Baruch make a median salary of $79,397 a year. This is a better than average outcome since the median salary for all public admin graduates with a master's is $58,617.
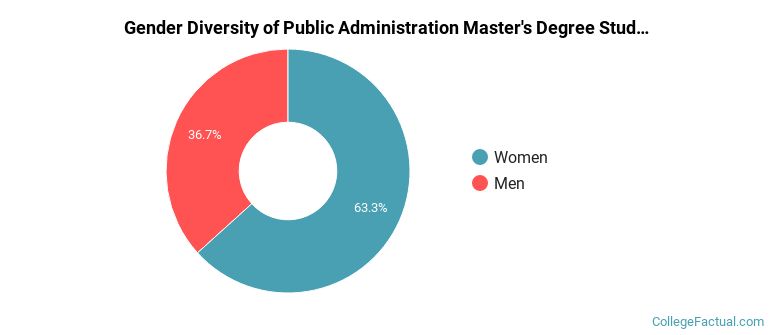
In the 2021-2022 academic year, 158 students earned a master's degree in public admin from Baruch. About 63% of these graduates were women and the other 37% were men.
The following table and chart show the ethnic background for students who recently graduated from Baruch College with a master's in public admin.
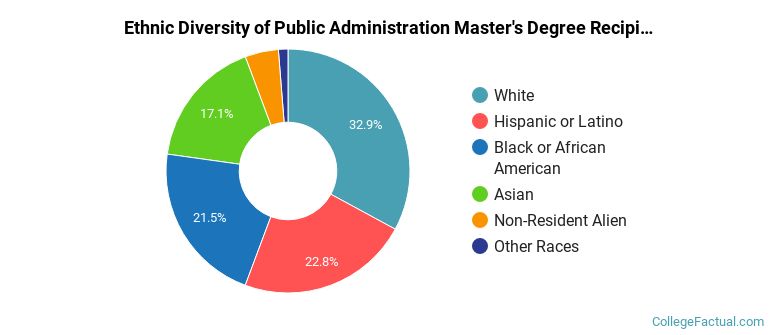
| Ethnic Background | Number of Students |
|---|---|
| Asian | 27 |
| Black or African American | 34 |
| Hispanic or Latino | 36 |
| White | 52 |
| Non-Resident Aliens | 7 |
| Other Races | 2 |
Take a look at the following statistics related to the make-up of the public admin majors at Baruch College.
More about our data sources and methodologies.