Baruch total enrollment is approximately 19,740 students. 12,421 are undergraduates and 780 are graduate students.
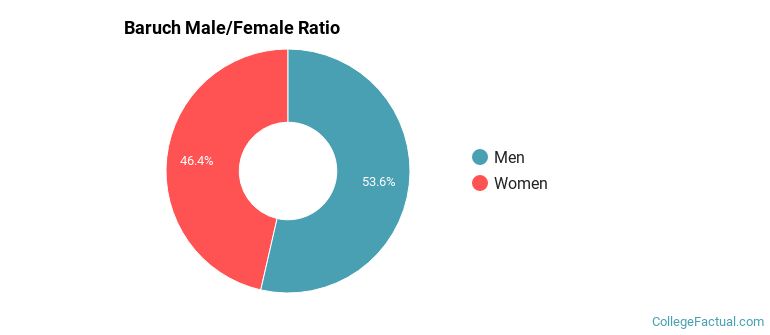
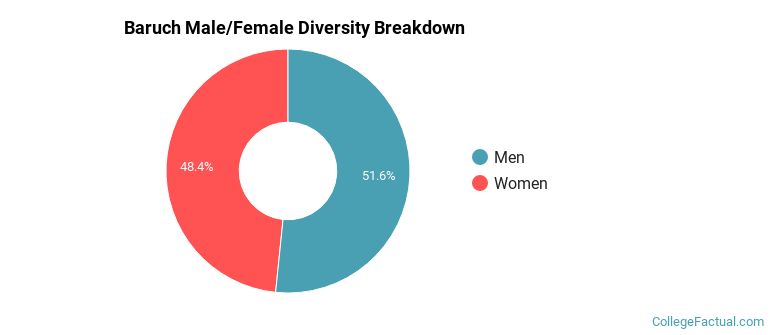
Male/Female Breakdown of Undergraduates
The full-time Baruch undergraduate population is made up of 47% women, and 53% men.
For the gender breakdown for all students, go here.
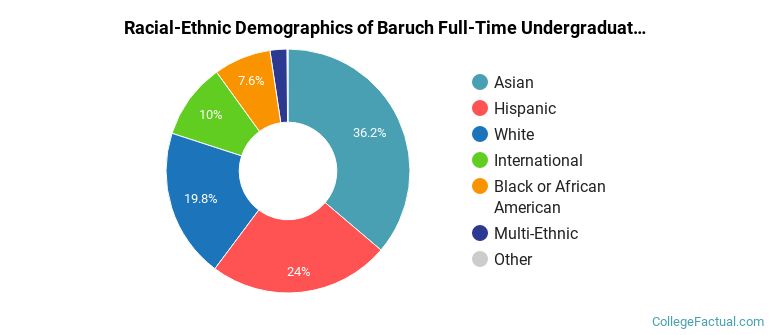
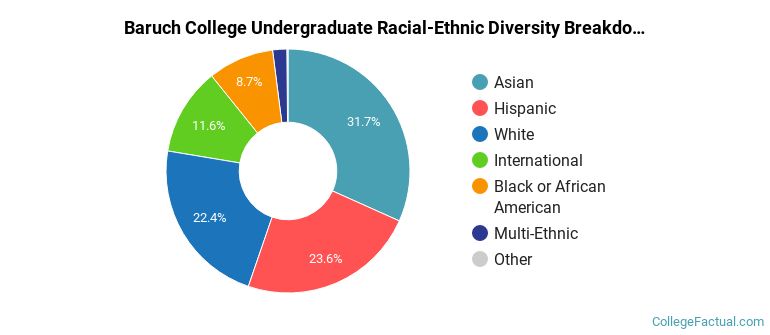
Baruch Racial/Ethnic Breakdown of Undergraduates
| Race/Ethnicity | Number |
|---|---|
| Asian | 4,656 |
| Hispanic | 2,934 |
| White | 2,469 |
| International | 1,050 |
| Black or African American | 950 |
| Multi-Ethnic | 337 |
| Native Hawaiian or Pacific Islander | 7 |
| Unknown | 0 |
See racial/ethnic breakdown for all students.
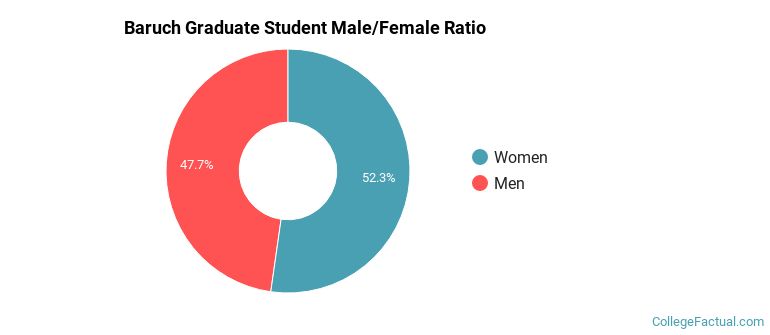
Male/Female Breakdown of Graduate Students
About 52% of full-time grad students are women, and 48% men.
For the gender breakdown for all students, go here.
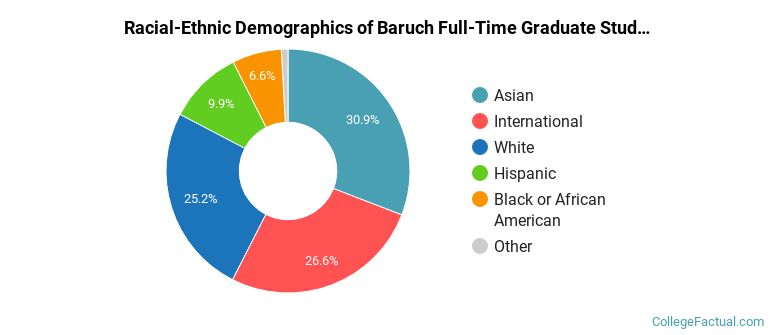
Baruch Racial-Ethnic Breakdown of Graduate Students
| Race/Ethnicity | Number |
|---|---|
| Asian | 264 |
| White | 199 |
| International | 136 |
| Hispanic | 104 |
| Black or African American | 67 |
| Multi-Ethnic | 9 |
| Native Hawaiian or Pacific Islander | 1 |
| Unknown | 0 |
See racial/ethnic breakdown for all students.
| Race/Ethnicity | Number |
|---|---|
| Asian | 6,389 |
| Hispanic | 4,639 |
| White | 4,428 |
| International | 2,018 |
| Black or African American | 1,777 |
| Multi-Ethnic | 445 |
| Native Hawaiian or Pacific Islander | 19 |
| Unknown | 0 |
There are approximately 9,719 female students and 10,021 male students at Baruch.
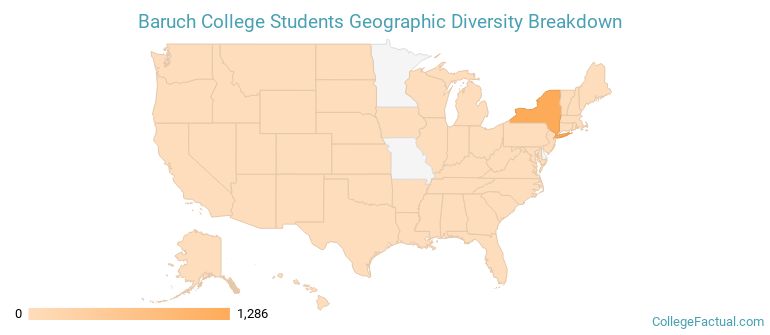
Baruch ranks 1,589 out of 2,183 when it comes to geographic diversity.
4.07% of Baruch students come from out of state, and 3.49% come from out of the country.
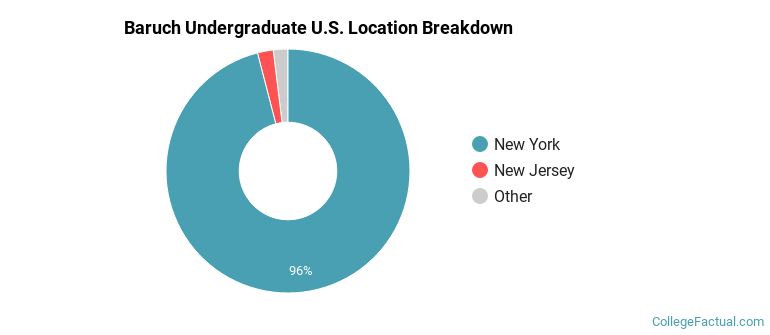
The undergraduate student body is split among 15 states (may include Washington D.C.). Click on the map for more detail.
| State | Amount |
|---|---|
| New York | 1,286 |
| New Jersey | 28 |
| California | 4 |
| Florida | 3 |
| Pennsylvania | 3 |
Students from 170 countries are represented at this school, with the majority of the international students coming from China, South Korea, and India.
Learn more about international students at Baruch.
A traditional college student is defined as being between the ages of 18-21. At Baruch, 38.80% of students fall into that category, compared to the national average of 60%.
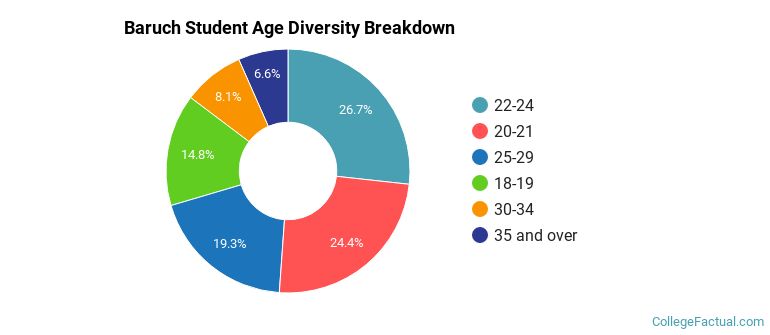
| Student Age Group | Amount |
|---|---|
| 22-24 | 4,835 |
| 20-21 | 4,411 |
| 25-29 | 3,489 |
| 18-19 | 2,685 |
| 30-34 | 1,466 |
| 35 and over | 1,196 |
| Under 18 | 0 |
Footnotes
*The racial-ethnic minorities count is calculated by taking the total number of students and subtracting white students, international students, and students whose race/ethnicity was unknown. This number is then divided by the total number of students at the school to obtain the racial-ethnic minorities percentage.
References
Department of Homeland Security Citizenship and Immigration Services
Image Credit: By Beyond My Ken under License
Read College Factual's Diversity Ranking Methodology.