CCNY total enrollment is approximately 15,227 students. 9,847 are undergraduates and 920 are graduate students.
Male/Female Breakdown of Undergraduates
The full-time CCNY undergraduate population is made up of 55% women, and 45% men.

For the gender breakdown for all students, go here.
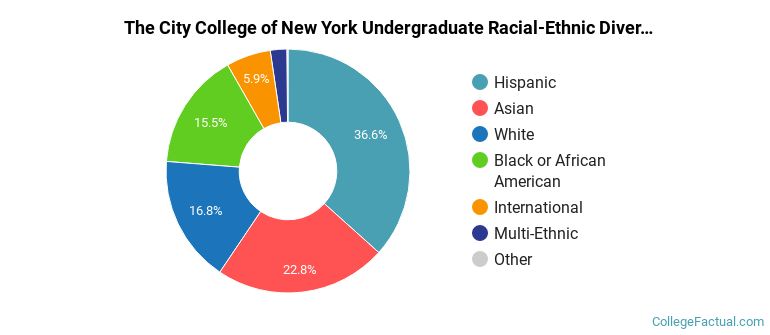
CCNY Racial/Ethnic Breakdown of Undergraduates

| Race/Ethnicity | Number |
|---|---|
| Hispanic | 3,724 |
| Asian | 2,725 |
| Black or African American | 1,342 |
| White | 1,225 |
| International | 542 |
| Multi-Ethnic | 262 |
| Native Hawaiian or Pacific Islander | 11 |
| Unknown | 0 |
See racial/ethnic breakdown for all students.
Male/Female Breakdown of Graduate Students
About 58% of full-time grad students are women, and 42% men.

For the gender breakdown for all students, go here.
CCNY Racial-Ethnic Breakdown of Graduate Students

| Race/Ethnicity | Number |
|---|---|
| White | 259 |
| Asian | 177 |
| Hispanic | 176 |
| Black or African American | 153 |
| International | 129 |
| Multi-Ethnic | 19 |
| Native Hawaiian or Pacific Islander | 3 |
| Unknown | 0 |
See racial/ethnic breakdown for all students.
| Race/Ethnicity | Number |
|---|---|
| Hispanic | 5,519 |
| Asian | 3,594 |
| White | 2,512 |
| Black or African American | 2,242 |
| International | 945 |
| Multi-Ethnic | 365 |
| Native Hawaiian or Pacific Islander | 24 |
| Unknown | 0 |

There are approximately 8,318 female students and 6,909 male students at CCNY.
CCNY ranks 1,763 out of 2,183 when it comes to geographic diversity.
1.77% of CCNY students come from out of state, and 0.82% come from out of the country.
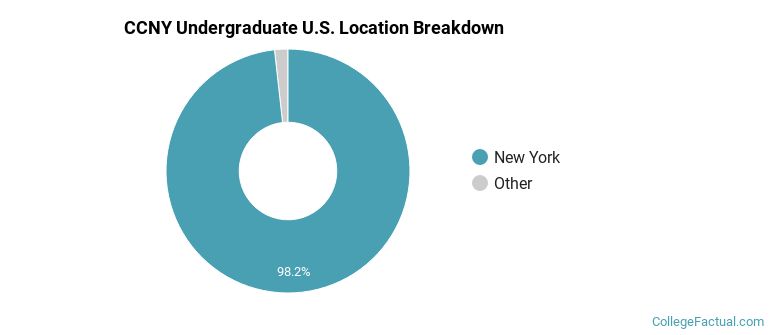
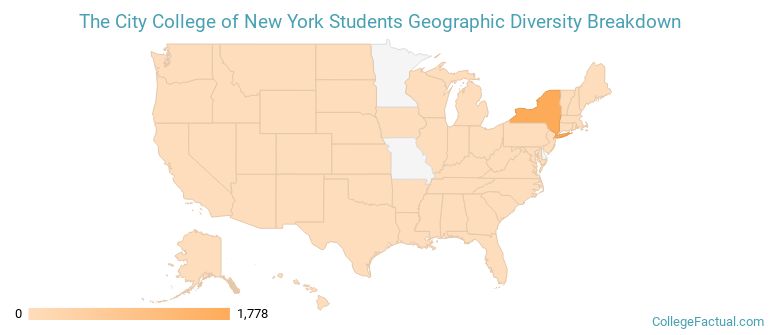
The undergraduate student body is split among 14 states (may include Washington D.C.). Click on the map for more detail.
| State | Amount |
|---|---|
| New York | 1,778 |
| New Jersey | 11 |
| Florida | 6 |
| Connecticut | 3 |
| Arizona | 2 |
Students from 170 countries are represented at this school, with the majority of the international students coming from China, South Korea, and India.
Learn more about international students at CCNY.
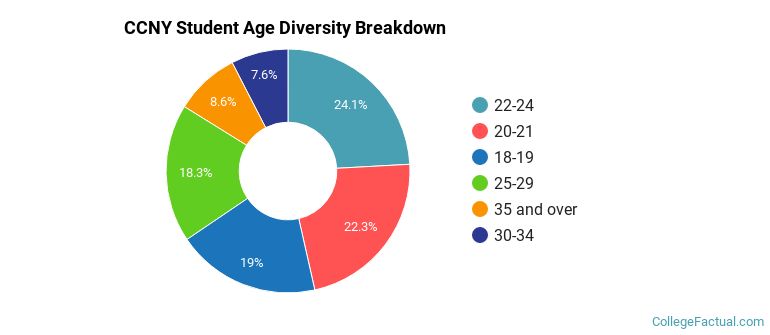
A traditional college student is defined as being between the ages of 18-21. At CCNY, 40.03% of students fall into that category, compared to the national average of 60%.
| Student Age Group | Amount |
|---|---|
| 22-24 | 3,733 |
| 20-21 | 3,458 |
| 18-19 | 2,948 |
| 25-29 | 2,837 |
| 35 and over | 1,328 |
| 30-34 | 1,172 |
| Under 18 | 0 |
Footnotes
*The racial-ethnic minorities count is calculated by taking the total number of students and subtracting white students, international students, and students whose race/ethnicity was unknown. This number is then divided by the total number of students at the school to obtain the racial-ethnic minorities percentage.
References
Department of Homeland Security Citizenship and Immigration Services
Read College Factual's Diversity Ranking Methodology.