Here is an overview of this program at Delaware County Community College. Degrees are awarded at the Associate’s, Undergraduate Certificate levels. At its best it places at #7 out of 14 schools (Associate’s level) by College Factual. Jump to any of the following sections:
By College Factual’s measure, Delaware County Community College among the top schools in the country for criminal justice & corrections, ranked #433 out of 1,112 schools nationally.
| Ranking | Rank |
|---|---|
| Best Criminal Justice & Corrections Schools | 433 of 1,112 |
| Best Criminal Justice & Corrections Schools in Pennsylvania | 31 of 58 |
| Best Criminal Justice & Corrections Schools in the Middle Atlantic Region | 104 of 190 |
The following degree levels are available for criminal justice & corrections at Delaware County Community College, along with how many graduates complete each level annually.
| Degree Level | Annual Graduates |
|---|---|
| Associate’s | 23 |
| Undergraduate Certificate | 45 |
During the most recent reporting year, Delaware County Community College conferred 23 associate’s degrees in criminal justice & corrections.
Delaware County Community College ranks competitively among schools offering criminal justice & corrections at the associate’s level. Its best result was #7 out of 14 schools by College Factual.
Information about average full-time undergraduate tuition and fees is shown in the table below.
| In State | Out of State | |
|---|---|---|
| Tuition | $7,500 | $12,600 |
| Fees | $2,730 | $2,940 |
Learn more about Delaware County Community College tuition and fees.
In the most recent graduating class, 39% of criminal justice & corrections associate’s degrees went to men and 61% went to women.
 The majority of criminal justice & corrections associate’s degree graduates at Delaware County Community College were White. Roughly 43% of graduates fell into this category.
The following table and chart show the ethnic background for students who recently graduated from Delaware County Community College with a associate’s in criminal justice & corrections.
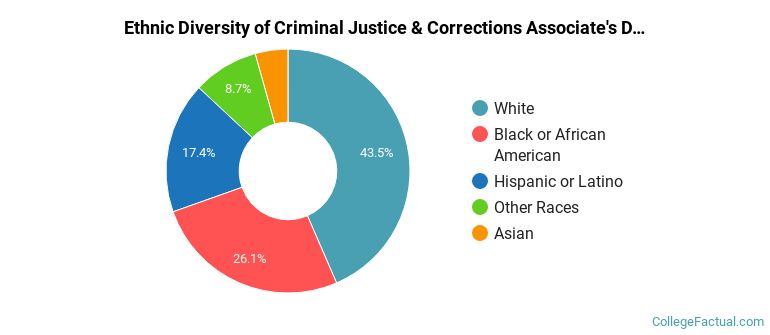
| Ethnic Background | Number of Students |
|---|---|
| Asian | 1 |
| Black or African American | 6 |
| Hispanic or Latino | 4 |
| White | 10 |
| Non-Resident Aliens | 0 |
| Other Races | 2 |
Delaware County Community College awarded 23 associate’s completions in criminal justice/safety studies in the most recent reporting year — 61% to women and 39% to men. The largest share of these graduates were White (43%).
During the most recent reporting year, Delaware County Community College awarded 45 undergraduate certificate degrees in criminal justice & corrections.
Delaware County Community College has not been ranked for criminal justice & corrections at the undergraduate certificate level.
In the most recent graduating class, 73% of criminal justice & corrections undergraduate certificate degrees went to men and 27% went to women.
 The majority of criminal justice & corrections undergraduate certificate degree graduates at Delaware County Community College were White. Approximately 49% of graduates fell into this category.
The following table and chart show the ethnic background for students who recently graduated from Delaware County Community College with a undergraduate certificate in criminal justice & corrections.

| Ethnic Background | Number of Students |
|---|---|
| Asian | 2 |
| Black or African American | 3 |
| Hispanic or Latino | 6 |
| White | 22 |
| Non-Resident Aliens | 0 |
| Other Races | 12 |
Delaware County Community College granted 45 undergraduate certificate degrees in criminal justice/police science recently — 27% to women and 73% to men. Most of these graduates identified as White (49%).
More about our data sources and methodologies.