In its yearly rankings, College Factual analyzes over 2,000 colleges and universities to determine which ones are the best in a variety of categories, such as overall value, quality, diversity, which schools are the best for each major, and much more.
DeVry University - Tennessee was awarded 4 badges in the 2024 rankings. The highest ranked major at the school is business, management & marketing.
Explore the best ranked schools for the programs you are most interested in.
DeVry University - Tennessee was not ranked in College Factual's 2024 Best Overall Colleges report. This could be for a number of reasons, including lack of data.
With an acceptance rate of 100%, DeVry University - Tennessee has a fairly liberal admissions policy. However, don't just assume you'll get in! Put together a good application and make sure you include all requested documents and materials.
The student to faculty ratio is often used to measure the number of teaching resources that a college or university offers its students. The national average for this metric is 15 to 1, but at DeVry University - Tennessee it is much better at 6 to 1. That's good news for students who want to interact more on a personal level with their teachers.
During the 2017-2018 academic year, there were 20 undergraduates at DeVry University - Tennessee with 12 being full-time and 8 being part-time.
The net price is calculated by adding tuition, room, board and other costs and subtracting financial aid.Note that the net price is typically less than the published for a school. For more information on the sticker price of DeVry University - Tennessee, see our tuition and fees and room and board pages.
The student loan default rate at DeVry University - Tennessee is 8.6%. Although this is lower than the national default rate of 10.1%, you'll still want to keep this in mind when taking out student loans.
Get more details about paying for DeVry University - Tennessee.
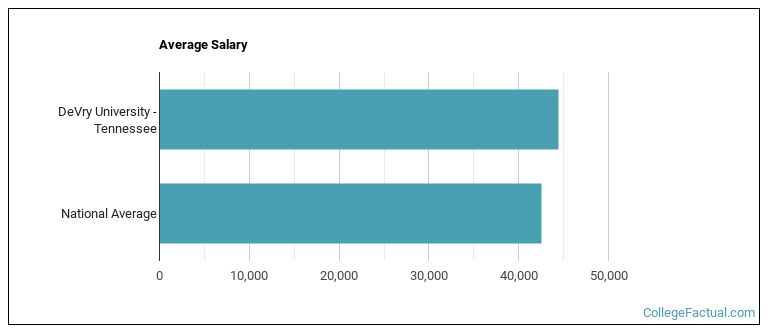
See which majors at DeVry University - Tennessee make the most money.
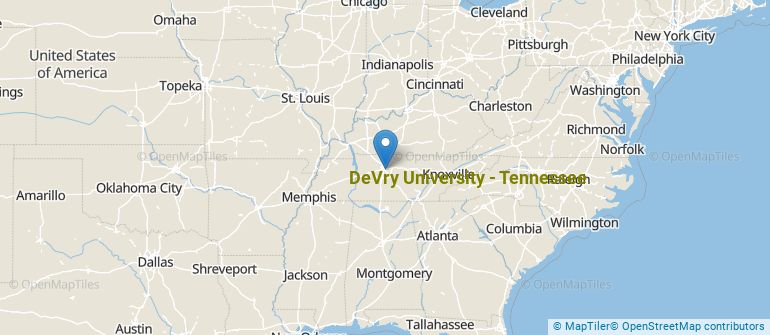
Get more details about the location of DeVry University - Tennessee.
Contact details for DeVry University - Tennessee are given below.
| Contact Details | |
|---|---|
| Address: | 301 South Perimeter Part Dr., Ste. 100, Nashville, TN 37211 |
| Phone: | 615-445-3456 |
| Website: | https://www.devry.edu/ |
| Facebook: | http://www.facebook.com/DEVRYUNIVERSITY |
| Twitter: | http://twitter.com/DeVryUniv |
| Most Popular Majors | Bachelor’s Degrees | Average Salary of Graduates |
|---|---|---|
| Business Administration & Management | 1 | $47,138 |
| General Business/Commerce | 1 | $48,403 |
| Accounting | 0 | NA |
| Human Resource Management | 0 | NA |
| Management Information Systems | 0 | NA |
| Communication & Media Studies | 0 | NA |
| Computer Software & Applications | 0 | $29,529 |
| Computer Systems Analysis | 0 | $47,609 |
| Computer Systems Networking | 0 | $50,307 |
| Health & Medical Administrative Services | 0 | $36,653 |
Online courses area a great option for busy, working students as well as for those who have scheduling conflicts and want to study on their own time. As time goes by, expect to see more and more online learning options become available.
In 2020-2021, 19 students took at least one online class at DeVry University - Tennessee. This is a decrease from the 26 students who took online classes the previous year.
| Year | Took at Least One Online Class | Took All Classes Online |
|---|---|---|
| 2020-2021 | 19 | 16 |
| 2019-2020 | 26 | 23 |
| 2018-2019 | 45 | 35 |
| 2017-2018 | 47 | 36 |
| 2016-2017 | 95 | 72 |
Learn more about online learning at DeVry University - Tennessee.
Footnotes
*The racial-ethnic minorities count is calculated by taking the total number of students and subtracting white students, international students, and students whose race/ethnicity was unknown. This number is then divided by the total number of students at the school to obtain the racial-ethnic minorities percentage.
References
More about our data sources and methodologies.