Jump to any of the following sections:
The personal & culinary services major at Diablo Valley is not ranked on College Factual’s Best Colleges and Universities for Personal & Culinary Services. This could be for a number of reasons, such as not having enough data on the major or school to make an accurate assessment of its quality.
During the 2022-2023 academic year, part-time undergraduate students at Diablo Valley paid an average of $346 per credit hour if they came to the school from out-of-state. In-state students paid a discounted rate of $46 per credit hour. The average full-time tuition and fees for undergraduates are shown in the table below.
| In State | Out of State | |
|---|---|---|
| Tuition | $1,288 | $8,304 |
| Fees | $24 | $24 |
| Books and Supplies | $1,190 | $1,190 |
Learn more about Diablo Valley tuition and fees.
Diablo Valley does not offer an online option for its personal & culinary services bachelor’s degree program at this time. To see if the school offers distance learning options in other areas, visit the Diablo Valley Online Learning page.
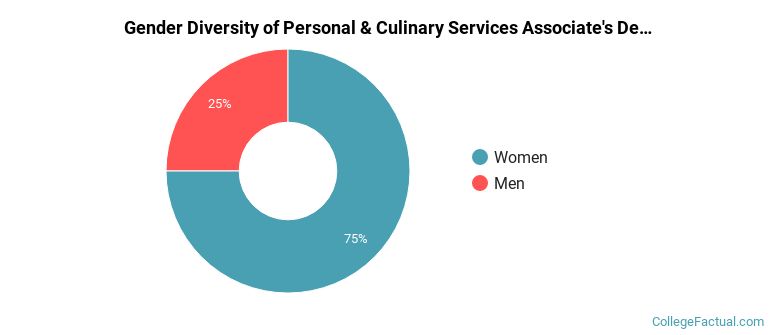
In the 2021-2022 academic year, 8 students earned a associate's degree in personal & culinary services from Diablo Valley. About 75% of these graduates were women and the other 25% were men.
The following table and chart show the ethnic background for students who recently graduated from Diablo Valley College with a associate's in personal & culinary services.
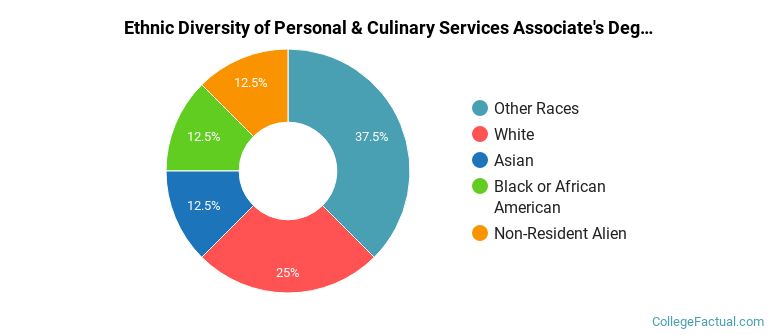
| Ethnic Background | Number of Students |
|---|---|
| Asian | 1 |
| Black or African American | 1 |
| Hispanic or Latino | 0 |
| White | 2 |
| Non-Resident Aliens | 1 |
| Other Races | 3 |
Personal & Culinary Services students may decide to major in one of the following focus areas. Individual majors may not be available for all degree levels.
| Major | Annual Graduates |
|---|---|
| Culinary Arts | 24 |
| Related Major | Annual Graduates |
|---|---|
| Mechanic & Repair Technologies | 23 |
| Construction Trades | 22 |