Explore the best ranked schools for the programs you are most interested in.
College Factual ranked Drew as #1,490 out of 2,152 colleges and universities in the country on its 2025 Best Colleges list.
Out of the 45 colleges in New Jersey, Drew is ranked at #37.
When it comes to admittance, Drew University is somewhat selective. Its acceptance rate is 73%, which means you'll face some strong competition during the admissions process. Do what you can to make your application stand out.
About 32% of students accepted to Drew submitted their SAT scores. When looking at the 25th through the 75th percentile, SAT Evidence-Based Reading and Writing scores ranged between 580 and 690. Math scores were between 540 and 650.
The student to faculty ratio at Drew is an impressive 12 to 1. That's quite good when you compare it to the national average of 15 to 1. This is a good sign that students at the school will have more opportunities for one-on-one interactions with their professors.
Another measure that is often used to estimate how much access students will have to their professors is how many faculty members are full-time. The idea here is that part-time faculty tend to spend less time on campus, so they may not be as available to students as full-timers.
The full-time faculty percentage at Drew University is 49%. This is comparable to the national average of 47%.
The freshmen retention rate of 88% tells us that most first-year, full-time students like Drew University enough to come back for another year. This is a fair bit higher than the national average of 68%. That's certainly something to check off in the good column about the school.
The on-time graduation rate for someone pursuing a bachelor's degree is typically four years. This rate at Drew for first-time, full-time students is 64%, which is better than the national average of 33.3%.
Find out more about the retention and graduation rates at Drew University.
During the 2017-2018 academic year, there were 1,636 undergraduates at Drew with 1,603 being full-time and 33 being part-time.
| $0-30 K | $30K-48K | $48-75 | $75-110K | $110K + |
|---|---|---|---|---|
| $15,853 | $18,426 | $20,879 | $26,292 | $32,920 |
The net price is calculated by adding tuition, room, board and other costs and subtracting financial aid.Note that the net price is typically less than the published for a school. For more information on the sticker price of Drew, see our tuition and fees and room and board pages.
It's not uncommon for college students to take out loans to pay for school. In fact, almost 66% of students nationwide depend at least partially on loans. At Drew, approximately 52% of students took out student loans averaging $9,988 a year. That adds up to $39,952 over four years for those students.
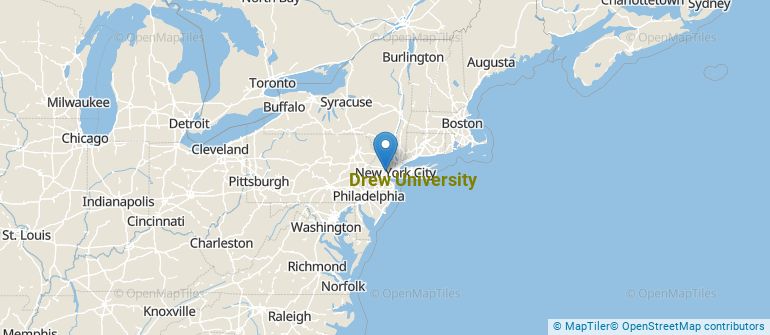
Get more details about the location of Drew University.
Contact details for Drew are given below.
| Contact Details | |
|---|---|
| Address: | 36 Madison Ave, Madison, NJ 07940 |
| Phone: | 973-408-3000 |
| Website: | www.drew.edu/ |
| Most Popular Majors | Bachelor’s Degrees | Average Salary of Graduates |
|---|---|---|
| Theological & Ministerial Studies | 81 | NA |
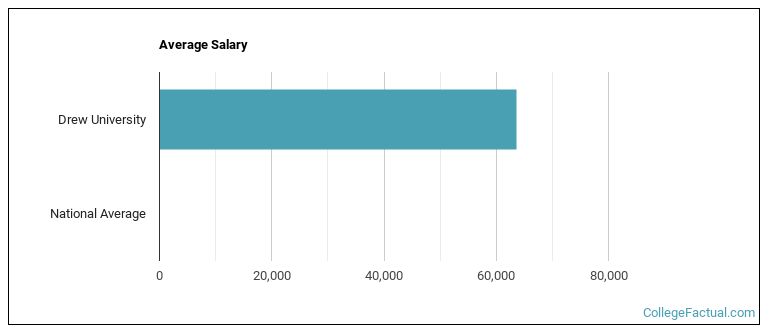
| Business Administration & Management | 50 | $40,242 |
| General Psychology | 47 | NA |
| Economics | 29 | $33,639 |
| General Biology | 28 | $24,229 |
| Political Science & Government | 25 | $35,171 |
| General English Literature | 22 | $32,279 |
| Communication & Media Studies | 21 | NA |
| Other Multi/Interdisciplinary Studies | 21 | NA |
| Computer Science | 20 | $47,689 |
Online learning is becoming popular at even the oldest colleges and universities in the United States. Not only are online classes great for returning adults with busy schedules, they are also frequented by a growing number of traditional students.
In 2022-2023, 62 students took at least one online class at Drew University. This is an increase from the 13 students who took online classes the previous year.
| Year | Took at Least One Online Class | Took All Classes Online |
|---|---|---|
| 2022-2023 | 62 | 50 |
| 2021-2022 | 13 | 0 |
| 2020-2021 | 2,229 | 2,229 |
| 2018-2019 | 108 | 27 |
If you’re considering Drew University, here are some more schools you may be interested in knowing more about.
Curious on how these schools stack up against Drew? Pit them head to head with College Combat, our free interactive tool that lets you compare college on the features that matter most to you!
Footnotes
*The racial-ethnic minorities count is calculated by taking the total number of students and subtracting white students, international students, and students whose race/ethnicity was unknown. This number is then divided by the total number of students at the school to obtain the racial-ethnic minorities percentage.
References
More about our data sources and methodologies.