We've gathered data and other essential information about the program, such as the average salary of graduates, ethnicity of students, how many students graduated in recent times, and more. Also, learn how ETSU ranks among other schools offering degrees in music.
Go directly to any of the following sections:
Learn about start dates, transferring credits, availability of financial aid, and more by contacting the universities below.
Earn the music business degree that fits into the business world – and partners Southern New Hampshire University with world-renowned Berklee College of Music.
The bachelor's program at ETSU was ranked #330 on College Factual's Best Schools for music list. It is also ranked #10 in Tennessee.
| Ranking Type | Rank |
|---|---|
| Best Music Bachelor’s Degree Schools | 317 |
| Best Music Schools | 330 |
During the 2021-2022 academic year, East Tennessee State University handed out 30 bachelor's degrees in music. This is a decrease of 23% over the previous year when 39 degrees were handed out.
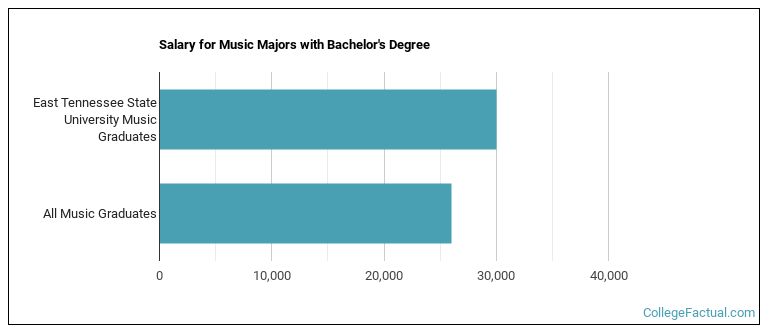
Music majors who earn their bachelor's degree from ETSU go on to jobs where they make a median salary of $30,004 a year. This is higher than $26,036, which is the national median for all music bachelor's degree recipients.
During the 2022-2023 academic year, part-time undergraduate students at ETSU paid an average of $444 per credit hour if they came to the school from out-of-state. In-state students paid a discounted rate of $316 per credit hour. The following table shows the average full-time tuition and fees for undergraduates.
| In State | Out of State | |
|---|---|---|
| Tuition | $7,706 | $11,034 |
| Fees | $2,000 | $2,000 |
| Books and Supplies | $1,350 | $1,350 |
| On Campus Room and Board | $10,270 | $10,270 |
| On Campus Other Expenses | $6,930 | $6,930 |
Learn more about ETSU tuition and fees.
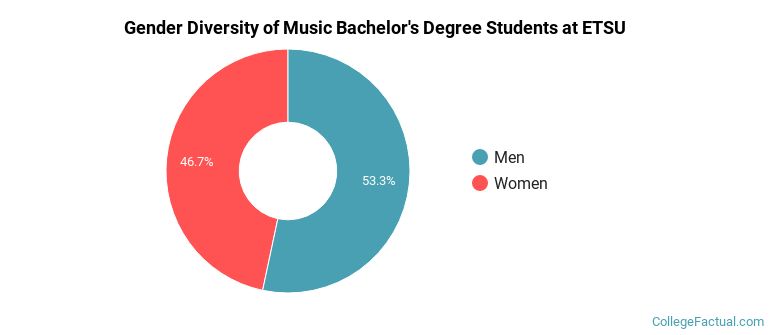
Of the 30 music students who graduated with a bachelor's degree in 2021-2022 from ETSU, about 53% were men and 47% were women.
The majority of the students with this major are white. About 87% of 2022 graduates were in this category.
The following table and chart show the ethnic background for students who recently graduated from East Tennessee State University with a bachelor's in music.
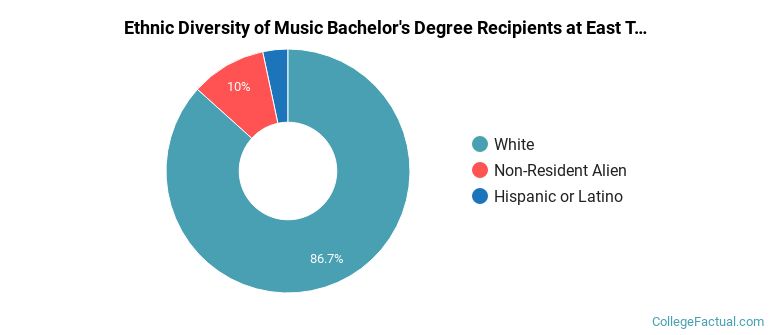
| Ethnic Background | Number of Students |
|---|---|
| Asian | 0 |
| Black or African American | 0 |
| Hispanic or Latino | 1 |
| White | 26 |
| Non-Resident Aliens | 3 |
| Other Races | 0 |
ETSU does not offer an online option for its music bachelor’s degree program at this time. To see if the school offers distance learning options in other areas, visit the ETSU Online Learning page.
Take a look at the following statistics related to the make-up of the music majors at East Tennessee State University.
| Related Major | Annual Graduates |
|---|---|
| Design & Applied Arts | 26 |
| Fine & Studio Arts | 25 |
| Drama & Theater Arts | 13 |
| Film, Video & Photographic Arts | 1 |
More about our data sources and methodologies.
