Jump to any of the following sections:
The social sciences major at El Camino College is not ranked on College Factual’s Best Colleges and Universities for Social Sciences. This could be for a number of reasons, such as not having enough data on the major or school to make an accurate assessment of its quality.
In 2022-2023, the average part-time undergraduate tuition at El Camino College was $296 per credit hour for out-of-state students. The average for in-state students was $46 per credit hour. The average full-time tuition and fees for undergraduates are shown in the table below.
| In State | Out of State | |
|---|---|---|
| Tuition | $1,104 | $7,104 |
| Fees | $40 | $40 |
| Books and Supplies | $2,136 | $2,136 |
Learn more about El Camino College tuition and fees.
El Camino College does not offer an online option for its social sciences bachelor’s degree program at this time. To see if the school offers distance learning options in other areas, visit the El Camino College Online Learning page.
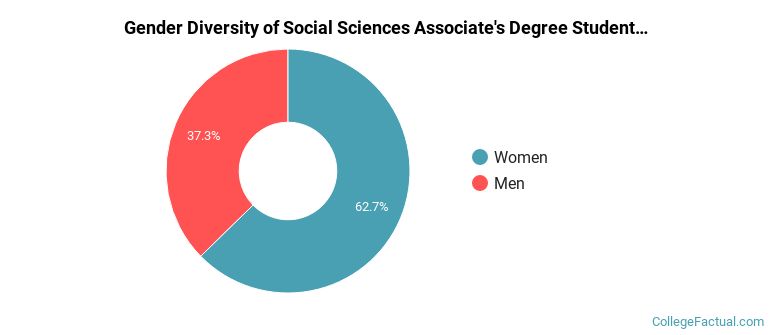
Of the 268 students who graduated with a Associate’s in social sciences from El Camino College in 2022, 37% were men and 63% were women.
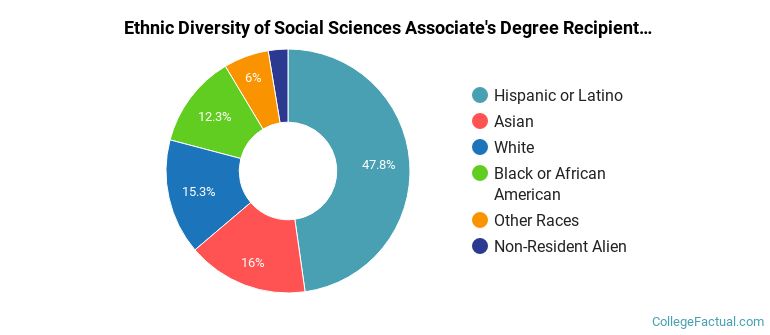
The following table and chart show the ethnic background for students who recently graduated from El Camino College with a associate's in social sciences.
| Ethnic Background | Number of Students |
|---|---|
| Asian | 43 |
| Black or African American | 33 |
| Hispanic or Latino | 128 |
| White | 41 |
| Non-Resident Aliens | 7 |
| Other Races | 16 |
Social Sciences students may decide to major in one of the following focus areas. Individual majors may not be available for all degree levels.
| Major | Annual Graduates |
|---|---|
| Sociology | 124 |
| Economics | 57 |
| Political Science & Government | 56 |
| Anthropology | 26 |
| Geography & Cartography | 5 |
| Related Major | Annual Graduates |
|---|---|
| Liberal Arts / Sciences & Humanities | 933 |
| Family, Consumer & Human Sciences | 208 |
| Communication & Journalism | 114 |
| English Language & Literature | 61 |
| Foreign Languages & Linguistics | 47 |