Here, you'll find out more about the major, including such details as the number of graduates, what degree levels are offered, ethnicity of students, average salaries, and more. Also, learn how Fairfield U ranks among other schools offering degrees in me.
Go directly to any of the following sections:
The bachelor's program at Fairfield U was ranked #159 on College Factual's Best Schools for me list. It is also ranked #2 in Connecticut.
| Ranking Type | Rank |
|---|---|
| Best Mechanical Engineering Schools | 159 |
| Best Mechanical Engineering Bachelor’s Degree Schools | 162 |
During the 2021-2022 academic year, Fairfield University handed out 26 bachelor's degrees in mechanical engineering. This is a decrease of 16% over the previous year when 31 degrees were handed out.
In 2022, 7 students received their master’s degree in me from Fairfield U. This makes it the #178 most popular school for me master’s degree candidates in the country.
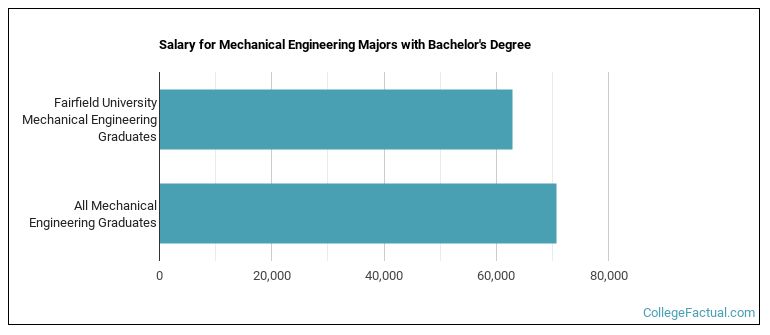
The median salary of me students who receive their bachelor's degree at Fairfield U is $62,846. This is less than $70,726, which is the national median of all me majors in the nation who earn bachelor's degrees.
During the 2022-2023 academic year, part-time undergraduate students at Fairfield U paid an average of $855 per credit hour. No discount was available for in-state students. Information about average full-time undergraduate tuition and fees is shown in the table below.
| In State | Out of State | |
|---|---|---|
| Tuition | $55,510 | $55,510 |
| Fees | $850 | $850 |
| Books and Supplies | $1,175 | $1,175 |
| On Campus Room and Board | $17,400 | $17,400 |
| On Campus Other Expenses | $2,005 | $2,005 |
Learn more about Fairfield U tuition and fees.
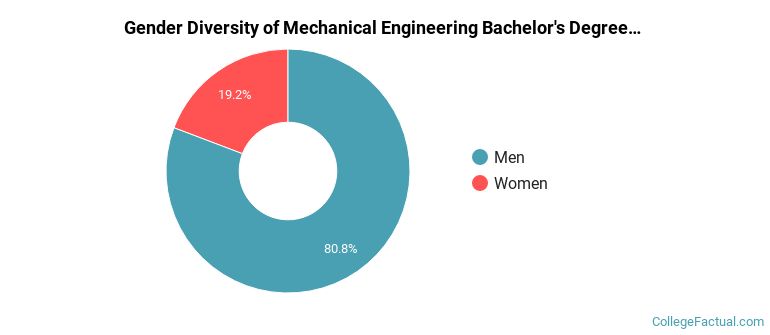
During the 2021-2022 academic year, 26 me majors earned their bachelor's degree from Fairfield U. Of these graduates, 81% were men and 19% were women.
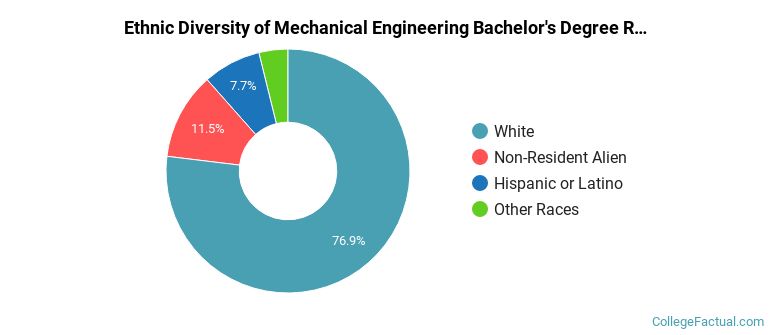
The majority of the students with this major are white. About 77% of 2022 graduates were in this category.
The following table and chart show the ethnic background for students who recently graduated from Fairfield University with a bachelor's in me.
| Ethnic Background | Number of Students |
|---|---|
| Asian | 0 |
| Black or African American | 0 |
| Hispanic or Latino | 2 |
| White | 20 |
| Non-Resident Aliens | 3 |
| Other Races | 1 |
Online degrees for the Fairfield U me bachelor’s degree program are not available at this time. To see if the school offers distance learning options in other areas, visit the Fairfield U Online Learning page.
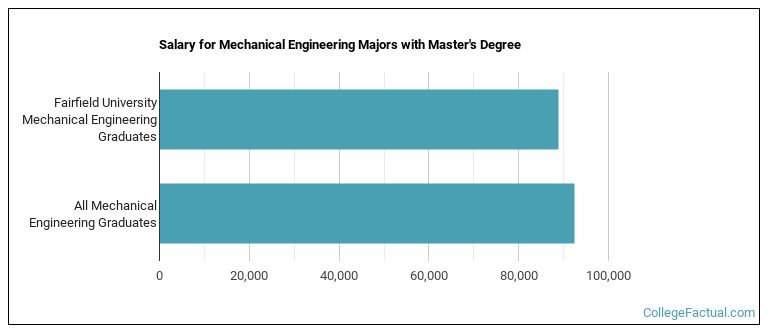
ME majors graduating with a master's degree from Fairfield U make a median salary of $88,944 a year. This is less than what their typical peers from other schools make. Their median salary is $92,526.
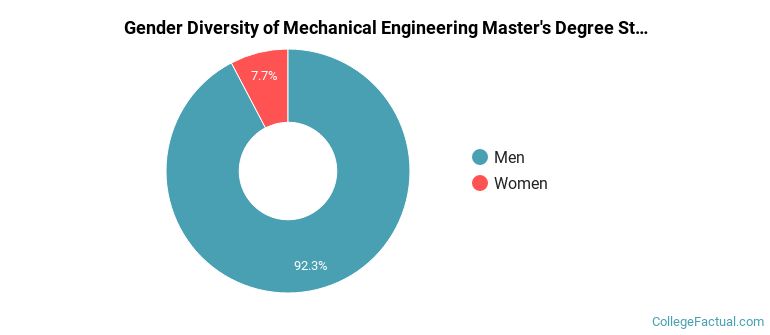
Of the 13 students who earned a master's degree in Mechanical Engineering from Fairfield U in 2021-2022, 92% were men and 8% were women.
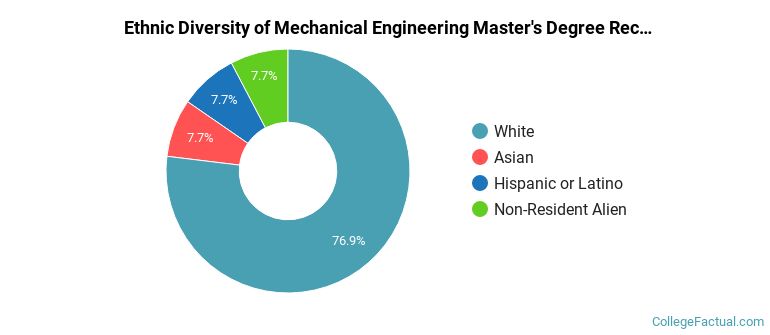
The majority of master's degree recipients in this major at Fairfield U are white. In the most recent graduating class for which data is available, 77% of students fell into this category.
The following table and chart show the ethnic background for students who recently graduated from Fairfield University with a master's in me.
| Ethnic Background | Number of Students |
|---|---|
| Asian | 1 |
| Black or African American | 0 |
| Hispanic or Latino | 1 |
| White | 10 |
| Non-Resident Aliens | 1 |
| Other Races | 0 |
Take a look at the following statistics related to the make-up of the me majors at Fairfield University.
| Related Major | Annual Graduates |
|---|---|
| Computer Engineering | 17 |
| Electrical Engineering | 17 |
| Biomedical Engineering | 11 |
| Industrial Engineering | 5 |
More about our data sources and methodologies.