We’ve pulled together the essential facts you should know about the program at Ferris State University. It is offered at the Bachelor’s, Associate’s, Certificate levels, with graduate study also available. It ranks as high as #1 out of 31 schools (Associate’s level) by College Factual. Jump to any of the following sections:
By College Factual’s measure, Ferris State University as a strong choice for business administration & management, coming in at #464 out of 2,027 schools nationally.
| Ranking | Rank |
|---|---|
| Best Business Administration & Management Schools | 464 of 2,027 |
| Best Business Administration & Management Schools in Michigan | 11 of 62 |
| Best Business Administration & Management Schools in the Great Lakes Region | 64 of 278 |
The following degree levels are offered in business administration & management at Ferris State University, along with how many graduates complete each level annually.
| Degree Level | Annual Graduates |
|---|---|
| Bachelor’s | 171 |
| Associate’s | 38 |
| Certificate | 30 |
| Master’s | 23 |
| Graduate Certificate | 2 |
For the most recent IPEDS reporting year, Ferris State University awarded 171 bachelor’s degrees in business administration & management.
Ferris State University holds a strong position among schools offering business administration & management at the bachelor’s level. In particular it placed #9 out of 31 schools by College Factual.
Business Administration & Management students who finish a bachelor’s at Ferris State University earn a median of $60,849 a year. This is lower than $62,925, the median for all majors at Ferris State University.
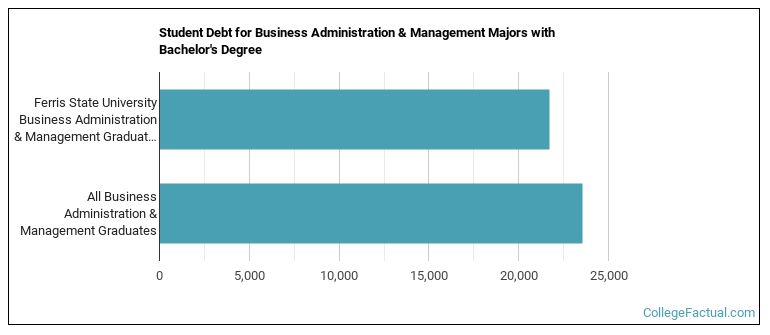
Earning a bachelor’s degree at Ferris State University, business administration & management students borrow a median amount of $21,713 in student loans. This is lower than $23,529, the typical median for all majors at Ferris State University.
The full-time undergraduate tuition and fees are shown below.
| In State | Out of State | |
|---|---|---|
| Tuition | $12,740 | $14,582 |
| Fees | $196 | $196 |
Find out more about Ferris State University tuition and fees.
In the most recent graduating class, 61% of business administration & management bachelor’s degrees went to men and 39% went to women.
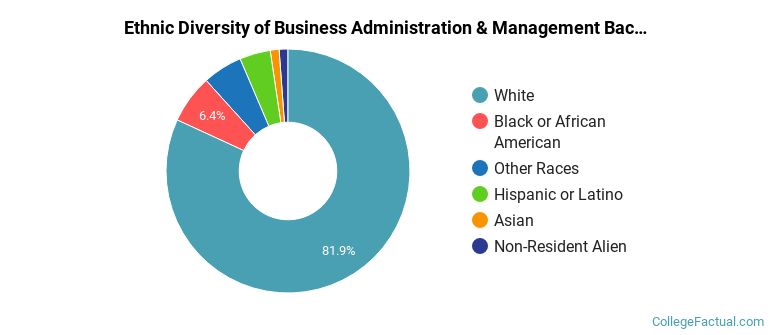
 The majority of business administration & management bachelor’s degree graduates at Ferris State University were White. Roughly 82% of graduates fell into this category.
The following table and chart show the ethnic background for students who recently graduated from Ferris State University with a bachelor’s in business administration & management.
| Ethnic Background | Number of Students |
|---|---|
| Asian | 2 |
| Black or African American | 11 |
| Hispanic or Latino | 7 |
| White | 140 |
| Non-Resident Aliens | 2 |
| Other Races | 9 |
Ferris State University conferred 143 bachelor’s completions in business administration and management, general in the most recent reporting year — 41% to women and 59% to men. Most of these graduates identified as White (83%).
Ferris State University awarded 28 bachelor’s completions in operations management and supervision in the latest year of data — 29% to women and 71% to men. The most common background among these graduates was White (79%).
During the most recent reporting year, Ferris State University conferred 38 associate’s degrees in business administration & management.
Ferris State University is among the very best schools in the country for business administration & management at the associate’s level. In particular it placed #1 out of 31 schools by College Factual.
For the most recent academic year available, 47% of business administration & management associate’s degrees went to men and 53% went to women.
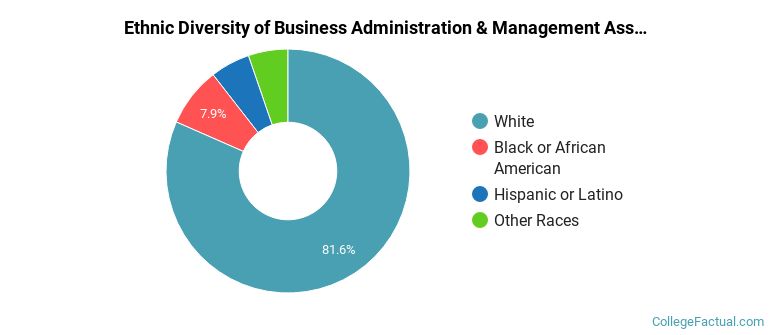
 The largest share of business administration & management associate’s degree graduates at Ferris State University were White. Roughly 82% of graduates fell into this category.
The following table and chart show the ethnic background for students who recently graduated from Ferris State University with a associate’s in business administration & management.
| Ethnic Background | Number of Students |
|---|---|
| Asian | 0 |
| Black or African American | 3 |
| Hispanic or Latino | 2 |
| White | 31 |
| Non-Resident Aliens | 0 |
| Other Races | 2 |
Ferris State University awarded 38 associate’s completions in business administration and management, general in the latest year of data — 53% to women and 47% to men. Most of these graduates identified as White (82%).
In the most recent year for which we have data, Ferris State University awarded 30 certificate degrees in business administration & management.
Ferris State University is not currently ranked for business administration & management at the certificate level.
Among recent graduates, 40% of business administration & management certificate degrees went to men and 60% went to women.
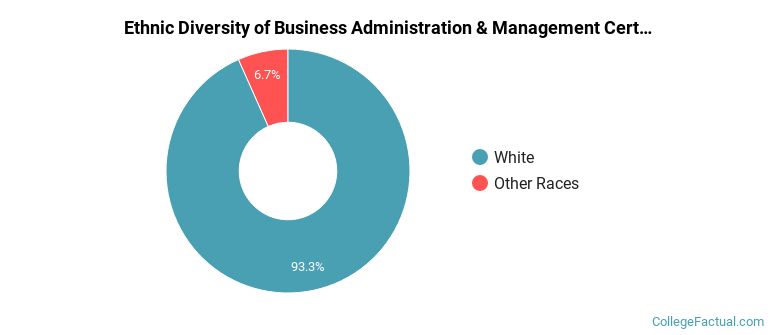
 The largest share of business administration & management certificate degree graduates at Ferris State University are White. About 93% of graduates fell into this category.
The following table and chart show the ethnic background for students who recently graduated from Ferris State University with a certificate in business administration & management.
| Ethnic Background | Number of Students |
|---|---|
| Asian | 0 |
| Black or African American | 0 |
| Hispanic or Latino | 0 |
| White | 28 |
| Non-Resident Aliens | 0 |
| Other Races | 2 |
Ferris State University granted 14 certificate completions in operations management and supervision in the most recent reporting year — 57% to women and 43% to men. The most common background among these graduates was White (93%).
Ferris State University awarded 13 certificate degrees in organizational leadership in the most recent reporting year — 62% to women and 38% to men. The largest share of these graduates were White (92%).
Ferris State University awarded 3 certificate degrees in e-commerce/electronic commerce in the most recent reporting year — 67% to women and 33% to men. The most common background among these graduates was White (100%).
This program is also offered at the graduate level at Ferris State University. Annual graduate completions by level are shown below.
| Graduate Level | Annual Graduates |
|---|---|
| Master’s Degrees in Business Administration & Management | 23 |
| Graduate Certificate Degrees in Business Administration & Management | 2 |
