We've pulled together some essential information you should know about the program, including how many students graduate each year, the ethnic diversity of these students, average starting salaries, and more. Also, learn how Gardner - Webb ranks among other schools offering degrees in grade specific ed.
Jump to any of the following sections:
The bachelor's program at Gardner - Webb was ranked #491 on College Factual's Best Schools for grade specific ed list. It is also ranked #19 in North Carolina.
| Ranking Type | Rank |
|---|---|
| Best Teacher Education Grade Specific Bachelor’s Degree Schools | 430 |
| Best Teacher Education Grade Specific Schools | 491 |
During the 2021-2022 academic year, Gardner - Webb University handed out 36 bachelor's degrees in teacher education grade specific. This is an increase of 16% over the previous year when 31 degrees were handed out.
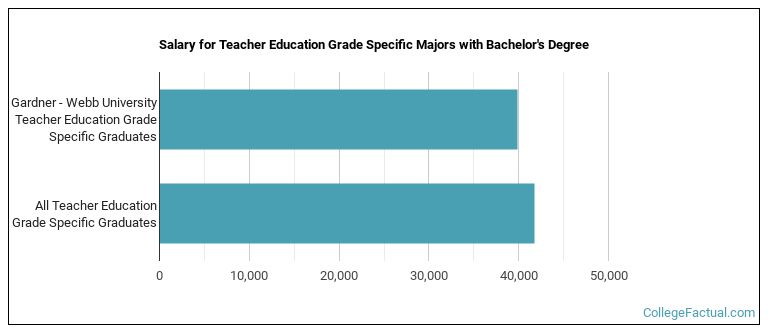
Grade Specific Ed majors who earn their bachelor's degree from Gardner - Webb go on to jobs where they make a median salary of $39,850 a year. This is less than $41,809, which is the national median of all grade specific ed majors in the nation who earn bachelor's degrees.
Part-time undergraduates at Gardner - Webb paid an average of $496 per credit hour in 2022-2023. This tuition was the same for both in-state and out-of-state students. The following table shows the average full-time tuition and fees for undergraduates.
| In State | Out of State | |
|---|---|---|
| Tuition | $32,470 | $32,470 |
| Fees | $980 | $980 |
| Books and Supplies | $1,000 | $1,000 |
| On Campus Room and Board | $10,770 | $10,770 |
| On Campus Other Expenses | $2,400 | $2,400 |
Learn more about Gardner - Webb tuition and fees.
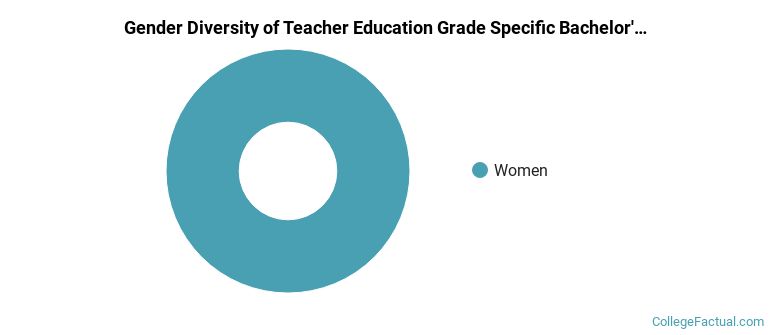
All of the 36 students who graduated with a Bachelor’s in grade specific ed from Gardner - Webb in 2022 were women.
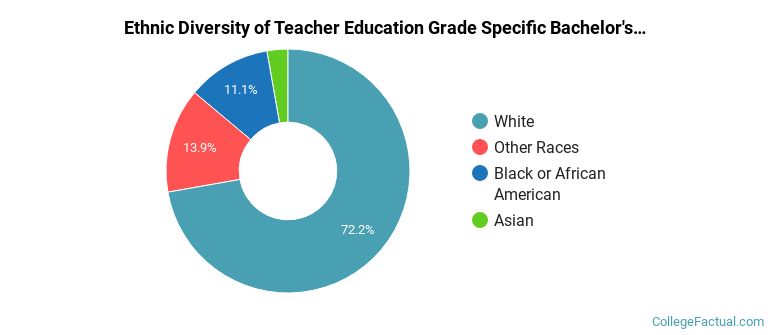
The majority of the students with this major are white. About 72% of 2022 graduates were in this category.
The following table and chart show the ethnic background for students who recently graduated from Gardner - Webb University with a bachelor's in grade specific ed.
| Ethnic Background | Number of Students |
|---|---|
| Asian | 1 |
| Black or African American | 4 |
| Hispanic or Latino | 0 |
| White | 26 |
| Non-Resident Aliens | 0 |
| Other Races | 5 |
Online degrees for the Gardner - Webb grade specific ed bachelor’s degree program are not available at this time. To see if the school offers distance learning options in other areas, visit the Gardner - Webb Online Learning page.
Take a look at the following statistics related to the make-up of the grade specific ed majors at Gardner - Webb University.
| Related Major | Annual Graduates |
|---|---|
| Educational Administration | 210 |
| Curriculum & Instruction | 34 |
| Student Counseling | 6 |
| Teacher Education Subject Specific | 2 |
| Instructional Media Design | 1 |
More about our data sources and methodologies.