We've pulled together some essential information you should know about the program, including how many students graduate each year, the ethnic diversity of these students, average starting salaries, and more. Also, learn how GWU ranks among other schools offering degrees in it.
Go directly to any of the following sections:
In College Factual's most recent rankings for the best schools for it majors, GWU came in at #12. This puts it in the top 5% of the country in this field of study. It is also ranked #2 in District of Columbia.
During the 2021-2022 academic year, George Washington University handed out 35 bachelor's degrees in information technology. This is a decrease of 46% over the previous year when 65 degrees were handed out.
In 2022, 144 students received their master’s degree in it from GWU. This makes it the #9 most popular school for it master’s degree candidates in the country.
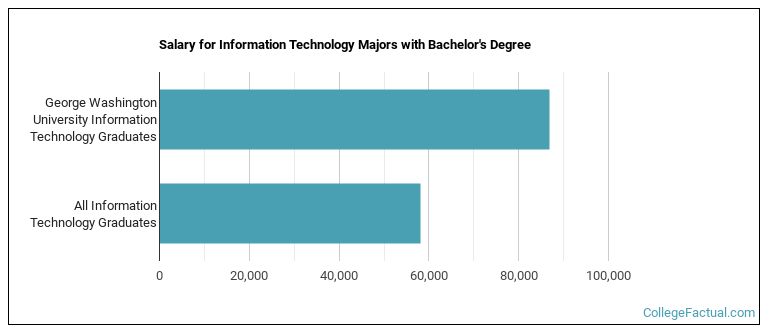
The median salary of it students who receive their bachelor's degree at GWU is $86,753. This is great news for graduates of the program, since this figure is higher than the national average of $58,147 for all it bachelor's degree recipients.
In 2022-2023, the average part-time undergraduate tuition at GWU was $2,080 per credit hour for both in-state and out-of-state students. Information about average full-time undergraduate tuition and fees is shown in the table below.
| In State | Out of State | |
|---|---|---|
| Tuition | $64,508 | $64,508 |
| Fees | $290 | $290 |
| Books and Supplies | $1,400 | $1,400 |
| On Campus Room and Board | $16,300 | $16,300 |
| On Campus Other Expenses | $1,625 | $1,625 |
Learn more about GWU tuition and fees.
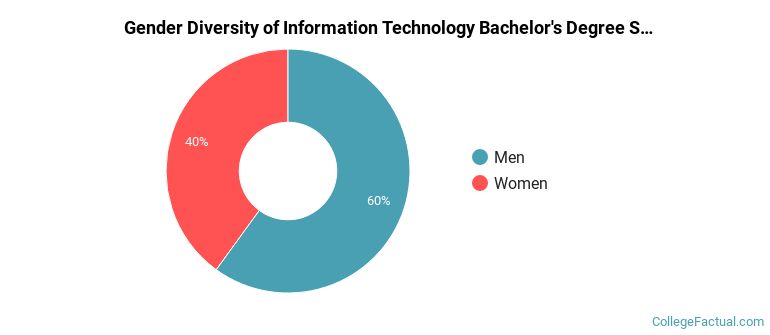
During the 2021-2022 academic year, 35 it majors earned their bachelor's degree from GWU. Of these graduates, 60% were men and 40% were women.
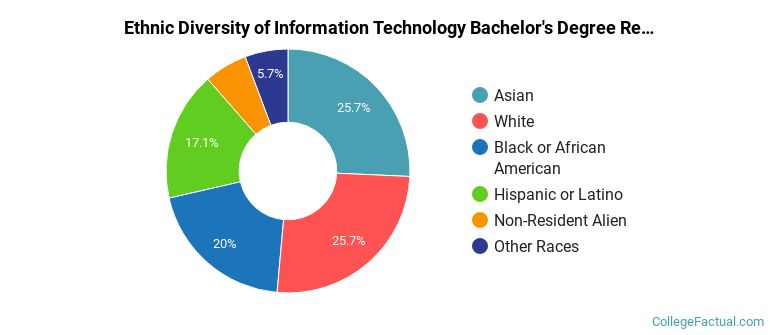
The following table and chart show the ethnic background for students who recently graduated from George Washington University with a bachelor's in it.
| Ethnic Background | Number of Students |
|---|---|
| Asian | 9 |
| Black or African American | 7 |
| Hispanic or Latino | 6 |
| White | 9 |
| Non-Resident Aliens | 2 |
| Other Races | 2 |
GWU does not offer an online option for its it bachelor’s degree program at this time. To see if the school offers distance learning options in other areas, visit the GWU Online Learning page.
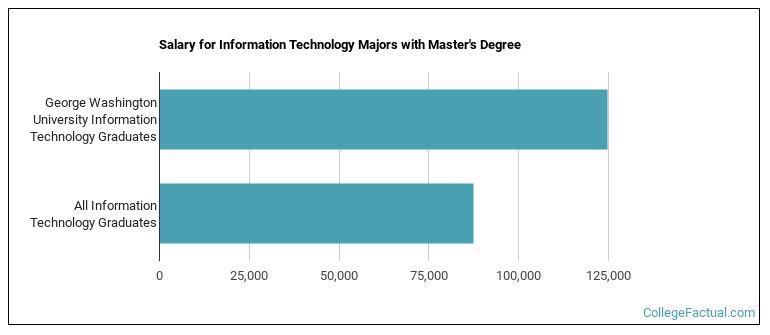
Graduates of the master's it program at GWU make a median salary of $124,635. This is a better than average outcome since the median salary for all it graduates with a master's is $87,435.
In the 2021-2022 academic year, 136 students earned a master's degree in it from GWU. About 40% of these graduates were women and the other 60% were men.

The following table and chart show the ethnic background for students who recently graduated from George Washington University with a master's in it.
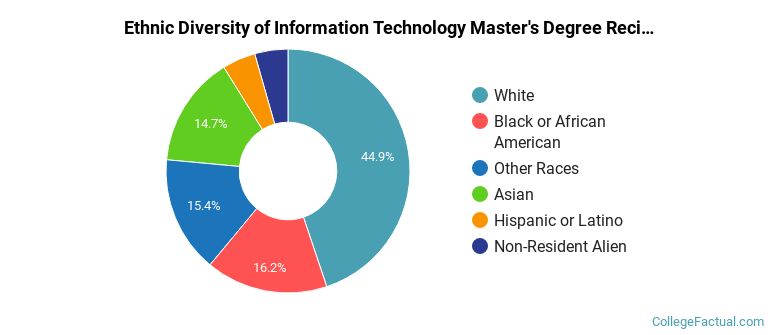
| Ethnic Background | Number of Students |
|---|---|
| Asian | 20 |
| Black or African American | 22 |
| Hispanic or Latino | 6 |
| White | 61 |
| Non-Resident Aliens | 6 |
| Other Races | 21 |
Take a look at the following statistics related to the make-up of the it majors at George Washington University.
| Related Major | Annual Graduates |
|---|---|
| Computer Science | 134 |
| Information Science | 81 |
| Computer Software & Applications | 58 |
| Computer Information Systems | 45 |
| Data Processing | 6 |
More about our data sources and methodologies.