Here is an overview of this program at GWU. It is offered at the Bachelor’s level, with graduate study also available. Its best result is a rank of #1 out of 1 schools (Bachelor’s level) by College Factual. Jump to any of the following sections:
College Factual ranks GWU as a strong choice for anthropology, ranked #44 out of 270 schools nationally.
| Ranking | Rank |
|---|---|
| Best Anthropology Schools | 44 of 270 |
| Best Anthropology Schools in District of Columbia | 1 of 1 |
| Best Anthropology Schools in the Middle Atlantic Region | 9 of 40 |
Here is each degree level offered in anthropology at GWU, along with how many graduates complete each level annually.
| Degree Level | Annual Graduates |
|---|---|
| Bachelor’s | 27 |
| Master’s | 15 |
| Doctoral | 4 |
For the most recent IPEDS reporting year, George Washington University handed out 27 bachelor’s degrees in anthropology.
GWU is among the very best schools in the country for anthropology at the bachelor’s level. In particular it placed #1 out of 1 schools by College Factual.
Anthropology students who finish a bachelor’s at GWU go on to jobs where they make a median salary of $49,003 a year. This is lower than $92,364, the median for all majors at GWU.
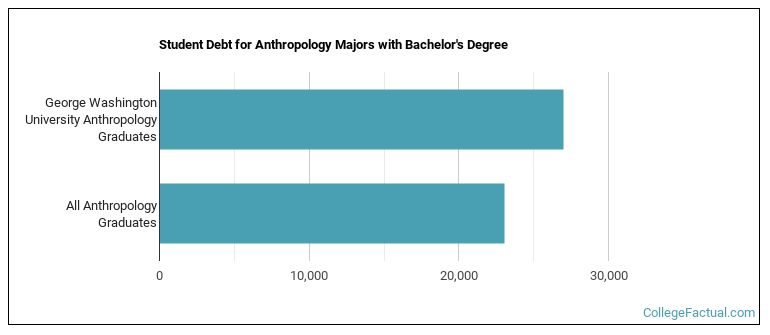
While getting their bachelor’s degree at GWU, anthropology students borrow a median amount of $27,000 in student loans. This is above $23,019, the typical median for all majors at GWU.
The full-time undergraduate tuition and fees are shown below.
| In State | Out of State | |
|---|---|---|
| Tuition | $59,780 | $67,420 |
| Fees | $290 | $290 |
Read more about GWU tuition and fees.
Among recent graduates, 11% of anthropology bachelor’s degrees went to men and 89% went to women.
 The largest share of anthropology bachelor’s degree graduates at GWU are White. Roughly 52% of graduates fell into this category.
The following table and chart show the ethnic background for students who recently graduated from George Washington University with a bachelor’s in anthropology.

| Ethnic Background | Number of Students |
|---|---|
| Asian | 4 |
| Black or African American | 0 |
| Hispanic or Latino | 5 |
| White | 14 |
| Non-Resident Aliens | 0 |
| Other Races | 4 |
GWU awarded 15 bachelor’s degrees in physical and biological anthropology in the latest year of data — 93% to women and 7% to men. The largest share of these graduates were White (47%).
Graduate study is also available at GWU. The following graduate award levels are reported.
| Graduate Level | Annual Graduates |
|---|---|
| Master’s Degrees in Anthropology | 15 |
| Doctoral Degrees in Anthropology | 4 |
