We've pulled together some essential information you should know about the program, including how many students graduate each year, the ethnic diversity of these students, average starting salaries, and more. In addition, we cover how Grand Canyon University ranks in comparison to other schools with human services programs.
Go directly to any of the following sections:
Grand Canyon University was ranked #15 on College Factual's most recent list of the best schools for human services majors. This puts the bachelor's program at the school solidly in the top 15% of all colleges and universities in the country. It is also ranked #2 in Arizona.
| Ranking Type | Rank |
|---|---|
| Best Human Services Bachelor’s Degree Schools | 12 |
| Best Human Services Schools | 15 |
During the 2021-2022 academic year, Grand Canyon University handed out 847 bachelor's degrees in human services. This is an increase of 0% over the previous year when 845 degrees were handed out.
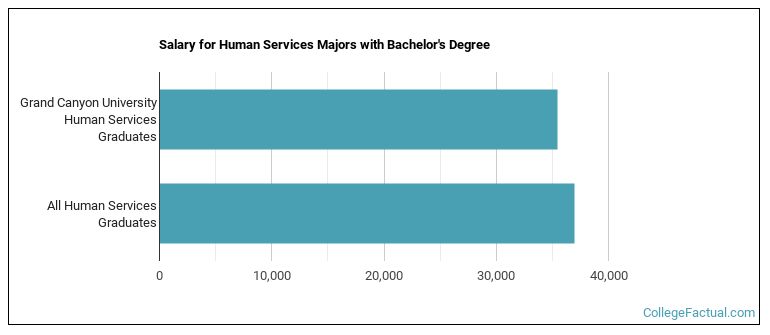
The median salary of human services students who receive their bachelor's degree at Grand Canyon University is $35,433. Unfortunately, this is lower than the national average of $36,940 for all human services students.
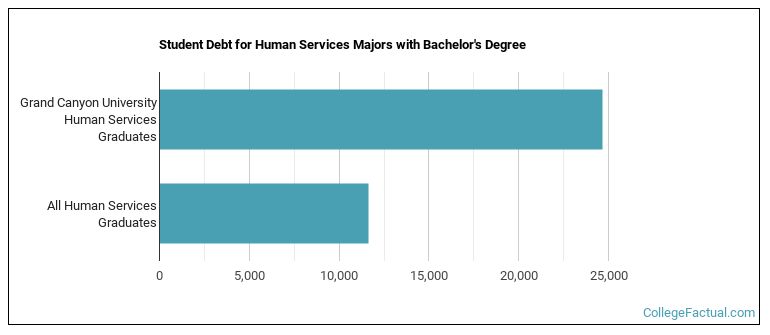
While getting their bachelor's degree at Grand Canyon University, human services students borrow a median amount of $24,652 in student loans. This is higher than the the typical median of $11,652 for all human services majors across the country.
The typical student loan payment of a bachelor's degree student from the human services program at Grand Canyon University is $217 per month.
During the 2022-2023 academic year, part-time undergraduate students at Grand Canyon University paid an average of $465 per credit hour. No discount was available for in-state students. Information about average full-time undergraduate tuition and fees is shown in the table below.
| In State | Out of State | |
|---|---|---|
| Tuition | $16,390 | $16,390 |
| Fees | $873 | $873 |
| Books and Supplies | $750 | $750 |
| On Campus Room and Board | $11,162 | $11,162 |
| On Campus Other Expenses | $4,300 | $4,300 |
Learn more about Grand Canyon University tuition and fees.
Of the 847 students who earned a bachelor's degree in Human Services from Grand Canyon University in 2021-2022, 17% were men and 83% were women.

The following table and chart show the ethnic background for students who recently graduated from Grand Canyon University with a bachelor's in human services.

| Ethnic Background | Number of Students |
|---|---|
| Asian | 16 |
| Black or African American | 103 |
| Hispanic or Latino | 219 |
| White | 409 |
| Non-Resident Aliens | 9 |
| Other Races | 91 |
Grand Canyon University does not offer an online option for its human services bachelor’s degree program at this time. To see if the school offers distance learning options in other areas, visit the Grand Canyon University Online Learning page.
Take a look at the following statistics related to the make-up of the human services majors at Grand Canyon University.
| Related Major | Annual Graduates |
|---|---|
| Community Organization & Advocacy | 407 |
| Public Administration | 238 |