Explore the best ranked schools for the programs you are most interested in.
Great Plains Technology Center was not ranked in College Factual's Best Overall Colleges report this year. This may be because not enough data was available.
Since Great Plains Technology Center has an open admissions policy, being accepted to the school isn't that hard. However, a full basic things - such as a high school diploma or equivalent - may be required. Also, go over your application to make sure it is complete before you submit it.
The student to faculty ratio is often used to measure the number of teaching resources that a college or university offers its students. The national average for this metric is 15 to 1, but at Great Plains Technology Center it is much better at 4 to 1. That's good news for students who want to interact more on a personal level with their teachers.
The freshmen retention rate of 87% tells us that most first-year, full-time students like Great Plains Technology Center enough to come back for another year. This is a fair bit higher than the national average of 68%. That's certainly something to check off in the good column about the school.
During the 2017-2018 academic year, there were 186 undergraduates at Great Plains Technology Center with 137 being full-time and 49 being part-time.
The net price is calculated by adding tuition, room, board and other costs and subtracting financial aid.Note that the net price is typically less than the published for a school. For more information on the sticker price of Great Plains Technology Center, see our tuition and fees and room and board pages.
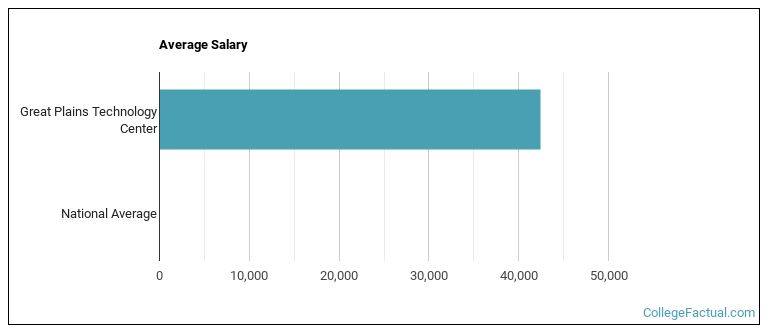
See which majors at Great Plains Technology Center make the most money.
Get more details about the location of Great Plains Technology Center.

Contact details for Great Plains Technology Center are given below.
| Contact Details | |
|---|---|
| Address: | 4500 Sw Lee Blvd, Lawton, OK 73505-8399 |
| Phone: | 580-355-6371 |
| Website: | www.greatplains.edu/ |
| Most Popular Majors | Bachelor’s Degrees | Average Salary of Graduates |
|---|---|---|
| Practical Nursing & Nursing Assistants | 53 | NA |
| Fire Protection | 13 | NA |
| Allied Health Professions | 11 | NA |
| Audiovisual Communications | 10 | NA |
| Vehicle Maintenance & Repair | 10 | NA |
| Computer Systems Networking | 8 | NA |
| Culinary Arts | 8 | NA |
| Graphic Communications | 7 | NA |
| Carpentry | 7 | NA |
| Electrical & Power Transmission Installers | 6 | NA |
Footnotes
*The racial-ethnic minorities count is calculated by taking the total number of students and subtracting white students, international students, and students whose race/ethnicity was unknown. This number is then divided by the total number of students at the school to obtain the racial-ethnic minorities percentage.
References
More about our data sources and methodologies.