Explore the best ranked schools for the programs you are most interested in.
According to College Factual's 2025 analysis, Hampton is ranked #1,501 out of 2,152 schools in the nation that were analyzed for overall quality. This is an improvement over the previous year, when Hampton held the #1,855 spot on the Best Overall Colleges list.
Out of the 57 colleges in Virginia, Hampton is ranked at #41.
Hampton University has an acceptance rate of 74%, which makes it somewhat selective. Make sure it's not the only school you apply to, even if it's your school of choice. Whether you get in or not will largely depend on how you compare to other applicants.
About 54% of students accepted to Hampton submitted their SAT scores. When looking at the 25th through the 75th percentile, SAT Evidence-Based Reading and Writing scores ranged between 420 and 620. Math scores were between 420 and 600.
With a student to faculty ratio of 13 to 1, Hampton University is about average in this regard as the nationwide rate is 15 to 1. While this does not translate directly to class size, it's a good indicator of how much time professors will have to spend with their students on a one-on-one basis.
When estimating how much access students will have to their teachers, some people like to look at what percentage of faculty members are full time. This is because part-time teachers may not have as much time to spend on campus as their full-time counterparts.
The full-time faculty percentage at Hampton University is 100%. This is higher than the national average of 47%.
The freshmen retention rate of 77% tells us that most first-year, full-time students like Hampton University enough to come back for another year. This is a fair bit higher than the national average of 68%. That's certainly something to check off in the good column about the school.
The on-time graduation rate for someone pursuing a bachelor's degree is typically four years. This rate at Hampton for first-time, full-time students is 44%, which is better than the national average of 33.3%.
Find out more about the retention and graduation rates at Hampton University.
During the 2017-2018 academic year, there were 3,063 undergraduates at Hampton with 2,814 being full-time and 249 being part-time.
| $0-30 K | $30K-48K | $48-75 | $75-110K | $110K + |
|---|---|---|---|---|
| $39,953 | $40,463 | $42,546 | $46,123 | $44,033 |
The net price is calculated by adding tuition, room, board and other costs and subtracting financial aid.Note that the net price is typically less than the published for a school. For more information on the sticker price of Hampton, see our tuition and fees and room and board pages.
While almost two-thirds of students nationwide take out loans to pay for college, the percentage may be quite different for the school you plan on attending. At Hampton, approximately 75% of students took out student loans averaging $12,966 a year. That adds up to $51,864 over four years for those students.
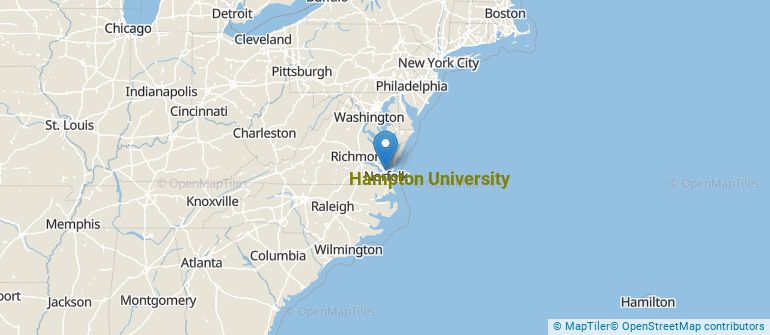
Get more details about the location of Hampton University.
Contact details for Hampton are given below.
| Contact Details | |
|---|---|
| Address: | 200 William R. Harvey Way, Hampton, VA 23668-0099 |
| Phone: | 757-727-5000 |
| Website: | www.hamptonu.edu/ |
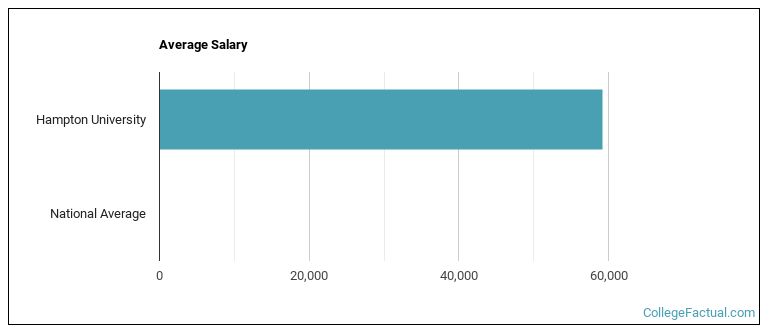
| Most Popular Majors | Bachelor’s Degrees | Average Salary of Graduates |
|---|---|---|
| Business Administration & Management | 99 | NA |
| Health & Physical Education | 71 | $27,633 |
| General Psychology | 67 | $29,154 |
| Journalism | 64 | $28,324 |
| General Biology | 56 | $30,359 |
| Liberal Arts General Studies | 43 | $37,179 |
| Criminal Justice & Corrections | 34 | $31,335 |
| Pharmacy/Pharmaceutical Sciences | 29 | NA |
| Marketing | 28 | $32,511 |
| Communication Sciences | 27 | NA |
Online courses area a great option for busy, working students as well as for those who have scheduling conflicts and want to study on their own time. As time goes by, expect to see more and more online learning options become available.
In 2022-2023, 374 students took at least one online class at Hampton University. This is a decrease from the 408 students who took online classes the previous year.
| Year | Took at Least One Online Class | Took All Classes Online |
|---|---|---|
| 2022-2023 | 374 | 374 |
| 2021-2022 | 408 | 408 |
| 2020-2021 | 371 | 343 |
| 2018-2019 | 286 | 216 |
If you’re considering Hampton University, here are some more schools you may be interested in knowing more about.
Curious on how these schools stack up against Hampton? Pit them head to head with College Combat, our free interactive tool that lets you compare college on the features that matter most to you!
Footnotes
*The racial-ethnic minorities count is calculated by taking the total number of students and subtracting white students, international students, and students whose race/ethnicity was unknown. This number is then divided by the total number of students at the school to obtain the racial-ethnic minorities percentage.
References
More about our data sources and methodologies.