Hebrew College total enrollment is approximately 137 students. 26 are undergraduates and 78 are graduate students.
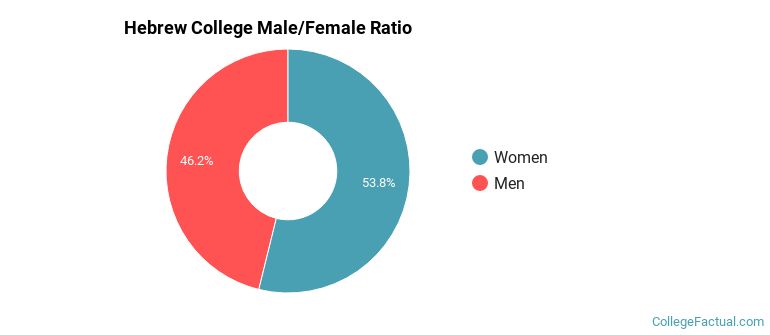
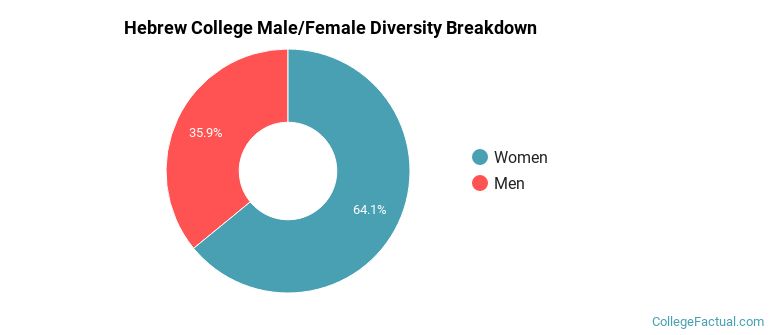
Male/Female Breakdown of Undergraduates
The full-time Hebrew College undergraduate population is made up of 50% women, and 50% men.
For the gender breakdown for all students, go here.
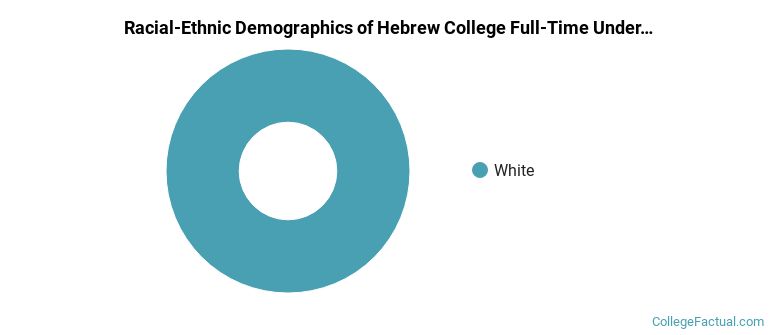
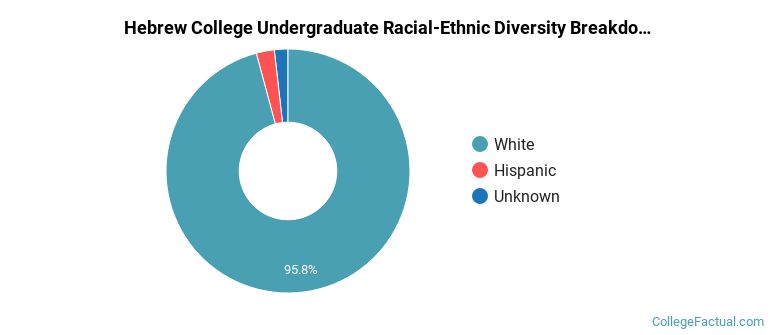
Hebrew College Racial/Ethnic Breakdown of Undergraduates
| Race/Ethnicity | Number |
|---|---|
| White | 26 |
| Asian | 0 |
| Black or African American | 0 |
| Hispanic | 0 |
| Native Hawaiian or Pacific Islander | 0 |
| International | 0 |
| Multi-Ethnic | 0 |
| Unknown | 0 |
See racial/ethnic breakdown for all students.
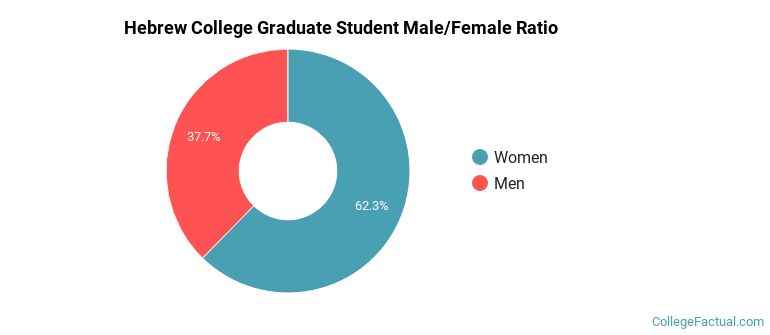
Male/Female Breakdown of Graduate Students
About 54% of full-time grad students are women, and 46% men.
For the gender breakdown for all students, go here.
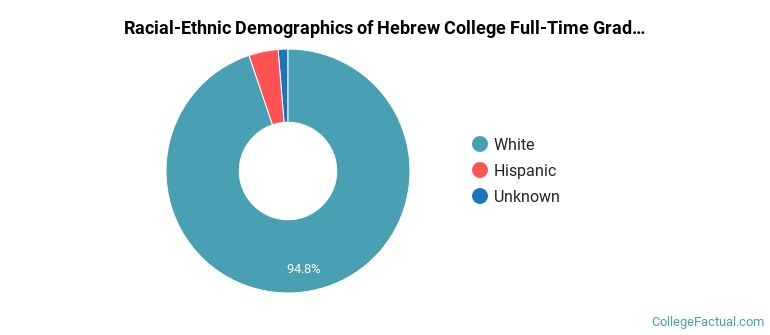
Hebrew College Racial-Ethnic Breakdown of Graduate Students
| Race/Ethnicity | Number |
|---|---|
| White | 63 |
| Unknown | 8 |
| International | 5 |
| Hispanic | 2 |
| Asian | 0 |
| Black or African American | 0 |
| Native Hawaiian or Pacific Islander | 0 |
| Multi-Ethnic | 0 |
See racial/ethnic breakdown for all students.
| Race/Ethnicity | Number |
|---|---|
| White | 120 |
| Unknown | 10 |
| International | 5 |
| Hispanic | 2 |
| Asian | 0 |
| Black or African American | 0 |
| Native Hawaiian or Pacific Islander | 0 |
| Multi-Ethnic | 0 |
There are approximately 79 female students and 58 male students at Hebrew College.
A traditional college student is defined as being between the ages of 18-21. At Hebrew College, 22.10% of students fall into that category, compared to the national average of 60%.
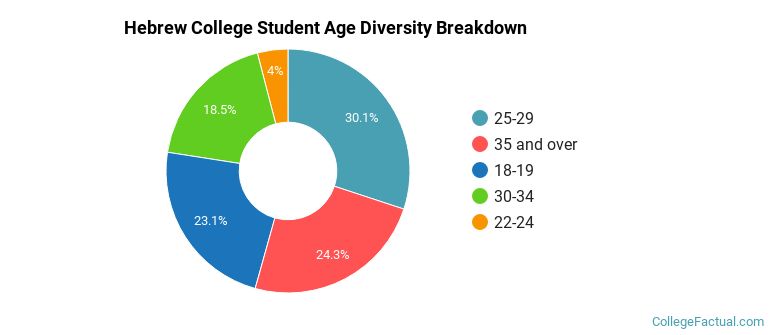
| Student Age Group | Amount |
|---|---|
| 25-29 | 52 |
| 35 and over | 42 |
| 18-19 | 40 |
| 30-34 | 32 |
| 22-24 | 7 |
| 20-21 | 0 |
| Under 18 | 0 |
Footnotes
*The racial-ethnic minorities count is calculated by taking the total number of students and subtracting white students, international students, and students whose race/ethnicity was unknown. This number is then divided by the total number of students at the school to obtain the racial-ethnic minorities percentage.
References