Explore the best ranked schools for the programs you are most interested in.
Hendrix is ranked #1,824 out of 2,152 schools in the nation for overall quality on College Factual's 2025 Best Colleges list.
Out of the 36 colleges in Arkansas, Hendrix is ranked at #18.
Hendrix College has an acceptance rate of 60%, which means the school is serious about who it admits. Take your time in putting together a strong application that highlights why you are a good fit for Hendrix.
About 15% of students accepted to Hendrix submitted their SAT scores. When looking at the 25th through the 75th percentile, SAT Evidence-Based Reading and Writing scores ranged between 580 and 680. Math scores were between 553 and 648.
The student to faculty ratio is often used to measure the number of teaching resources that a college or university offers its students. The national average for this metric is 15 to 1, but at Hendrix it is much better at 11 to 1. That's good news for students who want to interact more on a personal level with their teachers.
In addition to the student to faculty ratio, some people look at what percentage of faculty members are full-time as a sign of how much time professors will be able to spend with their students. This is because part-time teachers may not be be on campus as much as their full-time counterparts.
The full-time faculty percentage at Hendrix College is 100%. This is higher than the national average of 47%.
Hendrix College has a freshmen retention rate of 79%. That's a good sign that full-time students like the school and their professors enough to want to stick around for another year. It's also a sign that the admissions team did a good job in choosing applicants who were a good fit for the school.
Students are considered to have graduated on time if they finish their studies within four years. At Hendrix the on-time graduation rate of first-time, full-time students is 59%. That is great when compared to the national average of 33.3%
Find out more about the retention and graduation rates at Hendrix College.
During the 2017-2018 academic year, there were 1,067 undergraduates at Hendrix with 1,061 being full-time and 6 being part-time.
| $0-30 K | $30K-48K | $48-75 | $75-110K | $110K + |
|---|---|---|---|---|
| $14,694 | $19,080 | $21,365 | $25,471 | $25,807 |
The net price is calculated by adding tuition, room, board and other costs and subtracting financial aid.Note that the net price is typically less than the published for a school. For more information on the sticker price of Hendrix, see our tuition and fees and room and board pages.
Almost 66% of college students who graduated with the class of 2018 took out student loans, but that percentage varies from school to school. At Hendrix, approximately 47% of students took out student loans averaging $7,998 a year. That adds up to $31,992 over four years for those students.
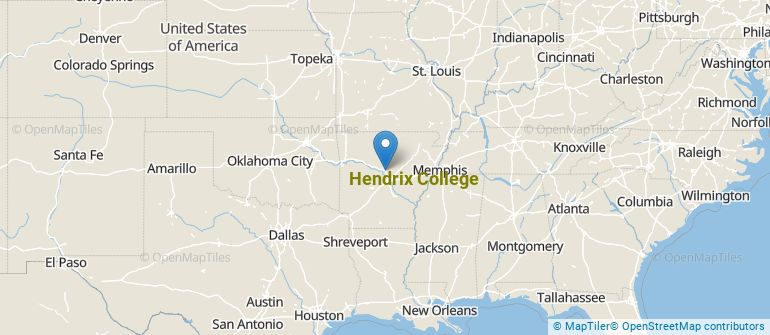
Get more details about the location of Hendrix College.
Contact details for Hendrix are given below.
| Contact Details | |
|---|---|
| Address: | 1600 Washington Ave, Conway, AR 72032-3080 |
| Phone: | 501-329-6811 |
| Website: | https://www.hendrix.edu/ |
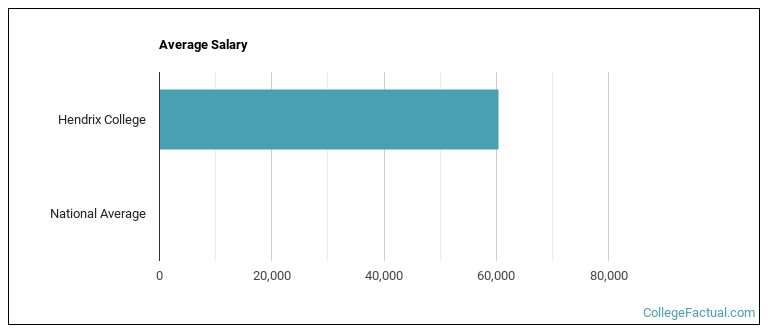
| Most Popular Majors | Bachelor’s Degrees | Average Salary of Graduates |
|---|---|---|
| General Psychology | 36 | $22,984 |
| Accounting | 26 | NA |
| Economics | 23 | $40,445 |
| Health Sciences & Services | 21 | NA |
| Biochemistry, Biophysics & Molecular Biology | 18 | $28,322 |
| General Biology | 18 | NA |
| General English Literature | 17 | $18,668 |
| Political Science & Government | 12 | NA |
| Neurobiology & Neurosciences | 10 | NA |
| Computer Science | 10 | NA |
If you’re considering Hendrix College, here are some more schools you may be interested in knowing more about.
Curious on how these schools stack up against Hendrix? Pit them head to head with College Combat, our free interactive tool that lets you compare college on the features that matter most to you!
Footnotes
*The racial-ethnic minorities count is calculated by taking the total number of students and subtracting white students, international students, and students whose race/ethnicity was unknown. This number is then divided by the total number of students at the school to obtain the racial-ethnic minorities percentage.
References
More about our data sources and methodologies.