We've pulled together some essential information you should know about the program, including how many students graduate each year, the ethnic diversity of these students, average starting salaries, and more. In addition, we cover how Herzing University - Atlanta ranks in comparison to other schools with legal support programs.
Jump to any of the following sections:
The legal support major at Herzing University - Atlanta is not ranked on College Factual’s Best Colleges and Universities for Legal Support Services. This could be for a number of reasons, such as not having enough data on the major or school to make an accurate assessment of its quality.
During the 2021-2022 academic year, Herzing University - Atlanta handed out 3 bachelor's degrees in legal support services.
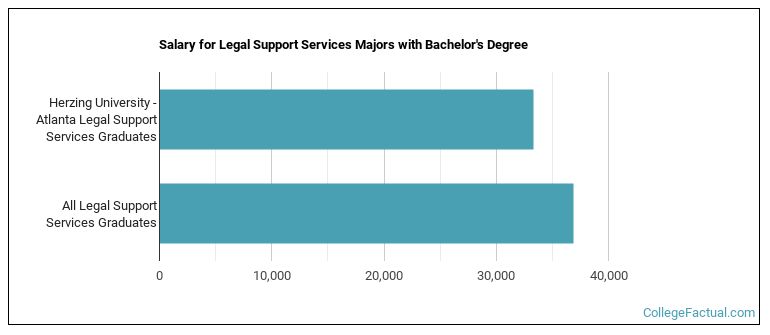
Legal Support majors who earn their bachelor's degree from Herzing University - Atlanta go on to jobs where they make a median salary of $33,315 a year. Unfortunately, this is lower than the national average of $36,900 for all legal support students.
In 2022-2023, the average part-time undergraduate tuition at Herzing University - Atlanta was $515 per credit hour for both in-state and out-of-state students. The following table shows the average full-time tuition and fees for undergraduates.
| In State | Out of State | |
|---|---|---|
| Tuition | $12,360 | $12,360 |
| Fees | $1,060 | $1,060 |
Learn more about Herzing University - Atlanta tuition and fees.
All of the 3 students who graduated with a Bachelor’s in legal support from Herzing University - Atlanta in 2022 were women.

The majority of the bachelor's degree graduates for this major are black or African Americans. About 100% of grads fell into this category.
The following table and chart show the ethnic background for students who recently graduated from Herzing University - Atlanta with a bachelor's in legal support.
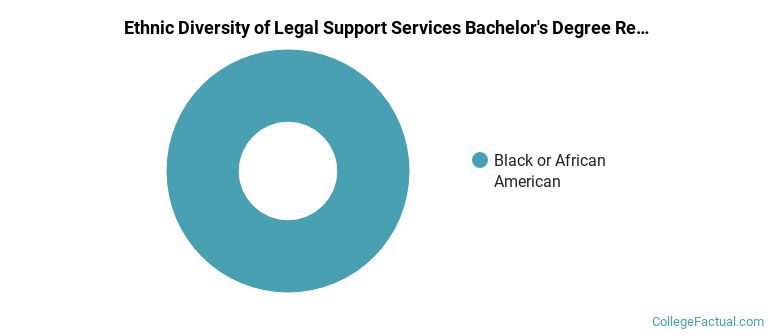
| Ethnic Background | Number of Students |
|---|---|
| Asian | 0 |
| Black or African American | 3 |
| Hispanic or Latino | 0 |
| White | 0 |
| Non-Resident Aliens | 0 |
| Other Races | 0 |
Online degrees for the Herzing University - Atlanta legal support bachelor’s degree program are not available at this time. To see if the school offers distance learning options in other areas, visit the Herzing University - Atlanta Online Learning page.
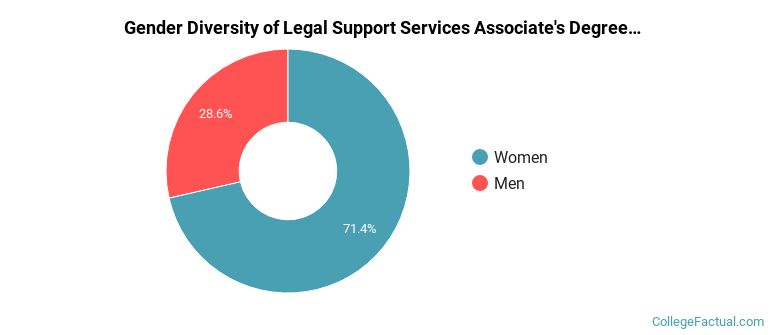
Of the 7 legal support students who graduated with a associate's degree in 2021-2022 from Herzing University - Atlanta, about 29% were men and 71% were women.
The majority of the associate's degree graduates for this major are black or African Americans. About 71% of grads fell into this category.
The following table and chart show the ethnic background for students who recently graduated from Herzing University - Atlanta with a associate's in legal support.
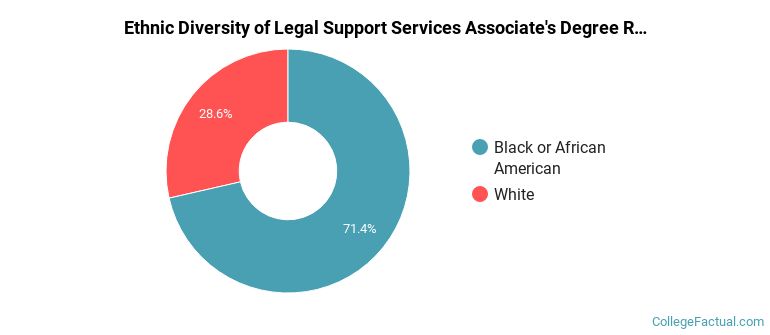
| Ethnic Background | Number of Students |
|---|---|
| Asian | 0 |
| Black or African American | 5 |
| Hispanic or Latino | 0 |
| White | 2 |
| Non-Resident Aliens | 0 |
| Other Races | 0 |
Take a look at the following statistics related to the make-up of the legal support majors at Herzing University - Atlanta.