
College Factual recognizes the best colleges and universities in its annual rankings. These rankings include categories for best overall colleges, best colleges for each major, best value schools, and much more.
Imperial Valley College was awarded 24 badges in the 2025 rankings. The highest ranked major at the school is biological & physical sciences.
Explore the best ranked schools for the programs you are most interested in.
According to College Factual's 2025 analysis, IVC is ranked #831 out of 2,152 schools in the nation that were analyzed for overall quality. This is an improvement over the previous year, when IVC held the #1,588 spot on the Best Overall Colleges list.
IVC also holds the #100 spot on the Best Colleges in California ranking.
If you are worried about getting into Imperial Valley College, don't be. The school has a liberal open admissions policy, which means you only need to meet basic requirements in order to be admitted. Still, be sure to submit a complete application and provide any other requested materials.
At Imperial Valley College, the student to faculty ratio is 31 to 1. Compared to the national average of 15 to 1, this is somewhat high. This could mean that class sizes may be larger than they are at other colleges or universities or that professors may be required to teach more classes.
In addition to the student to faculty ratio, some people look at what percentage of faculty members are full-time as a sign of how much time professors will be able to spend with their students. This is because part-time teachers may not be be on campus as much as their full-time counterparts.
The full-time faculty percentage at Imperial Valley College is 60%. This is higher than the national average of 47%.
The freshmen retention rate of 76% tells us that most first-year, full-time students like Imperial Valley College enough to come back for another year. This is a fair bit higher than the national average of 68%. That's certainly something to check off in the good column about the school.
During the 2017-2018 academic year, there were 7,123 undergraduates at IVC with 3,390 being full-time and 3,733 being part-time.
| $0-30 K | $30K-48K | $48-75 | $75-110K | $110K + |
|---|---|---|---|---|
| $3,607 | $3,937 | $4,427 | $10,578 | $5,873 |
The net price is calculated by adding tuition, room, board and other costs and subtracting financial aid.Note that the net price is typically less than the published for a school. For more information on the sticker price of IVC, see our tuition and fees and room and board pages.
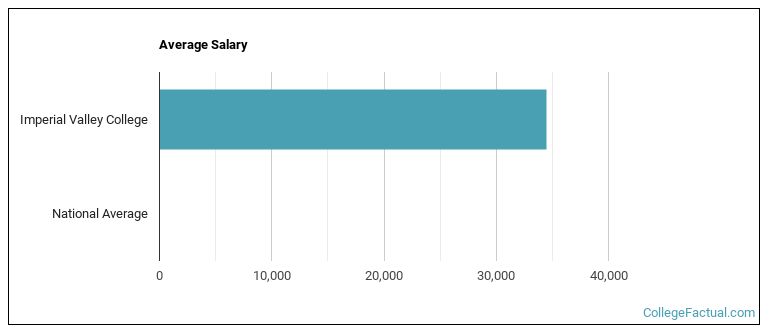
See which majors at Imperial Valley College make the most money.
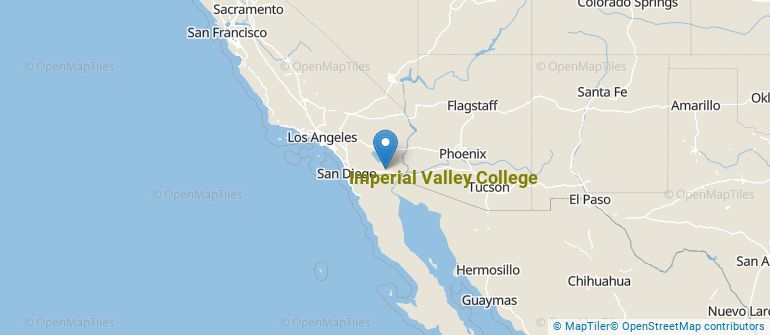
Get more details about the location of Imperial Valley College.
Contact details for IVC are given below.
| Contact Details | |
|---|---|
| Address: | 380 E. Aten Road, Imperial, CA 92251-0158 |
| Phone: | 760-352-8320 |
| Website: | www.imperial.edu/ |
| Most Popular Majors | Bachelor’s Degrees | Average Salary of Graduates |
|---|---|---|
| Liberal Arts General Studies | 986 | NA |
| Biological & Physical Science | 299 | NA |
| Criminal Justice & Corrections | 227 | NA |
| Behavioral Science | 161 | NA |
| General Psychology | 161 | NA |
| General Social Sciences | 75 | NA |
| Business Administration & Management | 66 | NA |
| Human Development & Family Studies | 66 | NA |
| Sociology | 58 | NA |
| Computer Information Systems | 32 | NA |
Online learning options are becoming more and more popular at American colleges and universities. Online classes are great for students who have busy schedules or for those who just want to study on their own time.
In 2022-2023, 5,720 students took at least one online class at Imperial Valley College. This is a decrease from the 6,469 students who took online classes the previous year.
| Year | Took at Least One Online Class | Took All Classes Online |
|---|---|---|
| 2022-2023 | 5,720 | 2,089 |
| 2021-2022 | 6,469 | 3,780 |
| 2020-2021 | 2,253 | 150 |
| 2018-2019 | 1,960 | 244 |
Learn more about online learning at Imperial Valley College.
Footnotes
*The racial-ethnic minorities count is calculated by taking the total number of students and subtracting white students, international students, and students whose race/ethnicity was unknown. This number is then divided by the total number of students at the school to obtain the racial-ethnic minorities percentage.
References
More about our data sources and methodologies.