Jump to any of the following sections:
IUPUI is in the top 10% of the country for liberal arts / sciences & humanities. More specifically it was ranked #55 out of 1,042 schools by College Factual. It is also ranked #3 in Indiana.
| Ranking Type | Rank |
|---|---|
| Best Liberal Arts / Sciences & Humanities Bachelor’s Degree Schools | 47 |
| Best Liberal Arts / Sciences & Humanities Schools | 55 |
During the 2021-2022 academic year, Indiana University - Purdue University - Indianapolis handed out 188 bachelor's degrees in liberal arts / sciences & humanities. This is a decrease of 28% over the previous year when 260 degrees were handed out.
Learn about other programs related to Liberal Arts / Sciences & Humanities that might interest you.
Maximize your transfer credits and complete your bachelor's degree faster with this flexible online bachelor's from Southern New Hampshire University.
During the 2022-2023 academic year, part-time undergraduate students at IUPUI paid an average of $1,084 per credit hour if they came to the school from out-of-state. In-state students paid a discounted rate of $308 per credit hour. The following table shows the average full-time tuition and fees for undergraduates.
| In State | Out of State | |
|---|---|---|
| Tuition | $9,241 | $32,509 |
| Fees | $1,208 | $1,208 |
| Books and Supplies | $690 | $690 |
| On Campus Room and Board | $13,010 | $13,010 |
| On Campus Other Expenses | $2,536 | $2,536 |
Learn more about IUPUI tuition and fees.
The liberal arts / sciences & humanities program at IUPUI awarded 188 bachelor's degrees in 2021-2022. About 35% of these degrees went to men with the other 65% going to women.

The majority of bachelor's degree recipients in this major at IUPUI are white. In the most recent graduating class for which data is available, 60% of students fell into this category.
The following table and chart show the ethnic background for students who recently graduated from Indiana University - Purdue University - Indianapolis with a bachelor's in liberal arts / sciences & humanities.
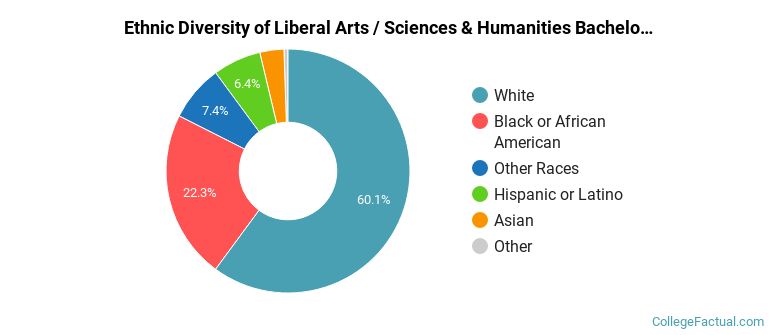
| Ethnic Background | Number of Students |
|---|---|
| Asian | 6 |
| Black or African American | 42 |
| Hispanic or Latino | 12 |
| White | 113 |
| Non-Resident Aliens | 1 |
| Other Races | 14 |
IUPUI does not offer an online option for its liberal arts / sciences & humanities bachelor’s degree program at this time. To see if the school offers distance learning options in other areas, visit the IUPUI Online Learning page.
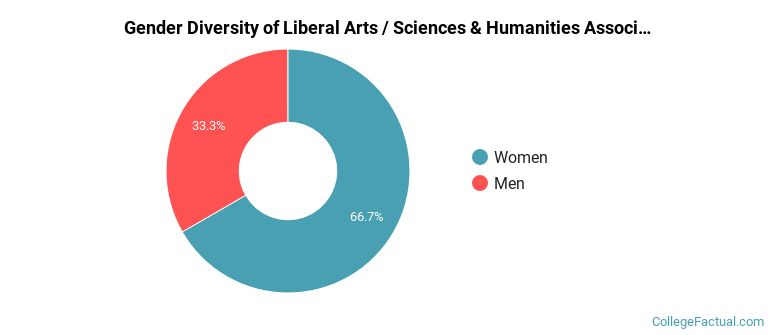
Of the 3 students who graduated with a Associate’s in liberal arts / sciences & humanities from IUPUI in 2022, 33% were men and 67% were women.
The majority of the students with this major are white. About 67% of 2022 graduates were in this category.
The following table and chart show the ethnic background for students who recently graduated from Indiana University - Purdue University - Indianapolis with a associate's in liberal arts / sciences & humanities.
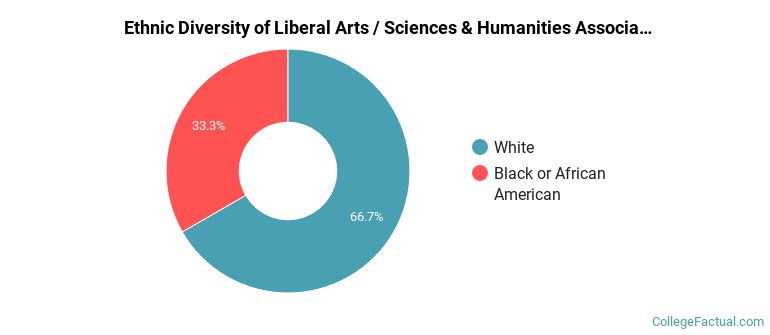
| Ethnic Background | Number of Students |
|---|---|
| Asian | 0 |
| Black or African American | 1 |
| Hispanic or Latino | 0 |
| White | 2 |
| Non-Resident Aliens | 0 |
| Other Races | 0 |
Take a look at the following statistics related to the make-up of the liberal arts / sciences & humanities majors at Indiana University - Purdue University - Indianapolis.
Liberal Arts / Sciences & Humanities students may decide to major in one of the following focus areas. Individual majors may not be available for all degree levels.
| Major | Annual Graduates |
|---|---|
| Liberal Arts General Studies | 191 |
| Related Major | Annual Graduates |
|---|---|
| Communication & Journalism | 215 |
| Social Sciences | 142 |
| English Language & Literature | 80 |
| Foreign Languages & Linguistics | 34 |
| History | 31 |
View All Liberal Arts / Sciences & Humanities Related Majors >
More about our data sources and methodologies.
