We've pulled together some essential information you should know about the program, including how many students graduate each year, the ethnic diversity of these students, average starting salaries, and more. We've also included details on how Iowa State ranks compared to other colleges offering a major in liberal arts.
Go directly to any of the following sections:
The bachelor's program at Iowa State was ranked #311 on College Factual's Best Schools for liberal arts list. It is also ranked #9 in Iowa.
| Ranking Type | Rank |
|---|---|
| Best Liberal Arts General Studies Bachelor’s Degree Schools | 152 |
| Best Liberal Arts General Studies Schools | 311 |
During the 2021-2022 academic year, Iowa State University handed out 70 bachelor's degrees in liberal arts general studies. This is a decrease of 13% over the previous year when 80 degrees were handed out.
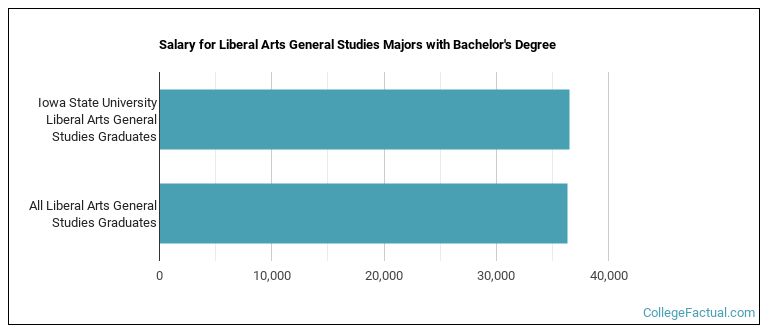
Liberal Arts majors who earn their bachelor's degree from Iowa State go on to jobs where they make a median salary of $36,532 a year. This is great news for graduates of the program, since this figure is higher than the national average of $36,340 for all liberal arts bachelor's degree recipients.
While getting their bachelor's degree at Iowa State, liberal arts students borrow a median amount of $43,140 in student loans. This is higher than the the typical median of $19,782 for all liberal arts majors across the country.
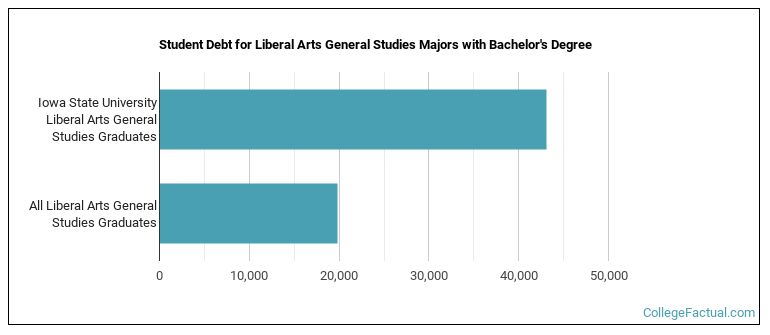
The typical student loan payment of a bachelor's degree student from the liberal arts program at Iowa State is $244 per month.
Learn about other programs related to Liberal Arts General Studies that might interest you.
Maximize your transfer credits and complete your bachelor's degree faster with this flexible online bachelor's from Southern New Hampshire University.
During the 2022-2023 academic year, part-time undergraduate students at Iowa State paid an average of $1,091 per credit hour if they came to the school from out-of-state. In-state students paid a discounted rate of $376 per credit hour. The following table shows the average full-time tuition and fees for undergraduates.
| In State | Out of State | |
|---|---|---|
| Tuition | $8,982 | $26,168 |
| Fees | $1,515 | $1,515 |
| Books and Supplies | $1,091 | $1,091 |
| On Campus Room and Board | $9,726 | $9,726 |
| On Campus Other Expenses | $2,890 | $2,890 |
Learn more about Iowa State tuition and fees.
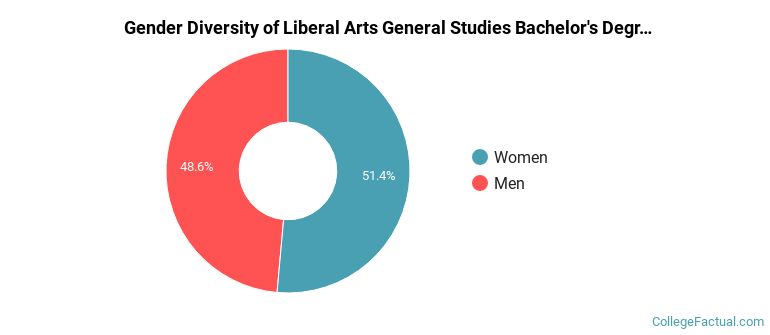
Of the 70 liberal arts students who graduated with a bachelor's degree in 2021-2022 from Iowa State, about 49% were men and 51% were women.
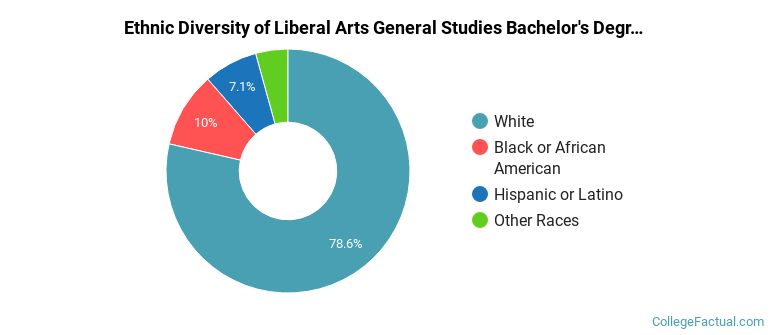
The majority of the students with this major are white. About 79% of 2022 graduates were in this category.
The following table and chart show the ethnic background for students who recently graduated from Iowa State University with a bachelor's in liberal arts.
| Ethnic Background | Number of Students |
|---|---|
| Asian | 0 |
| Black or African American | 7 |
| Hispanic or Latino | 5 |
| White | 55 |
| Non-Resident Aliens | 0 |
| Other Races | 3 |
Iowa State does not offer an online option for its liberal arts bachelor’s degree program at this time. To see if the school offers distance learning options in other areas, visit the Iowa State Online Learning page.
Take a look at the following statistics related to the make-up of the liberal arts majors at Iowa State University.
More about our data sources and methodologies.
