Here, you'll find out more about the major, including such details as the number of graduates, what degree levels are offered, ethnicity of students, average salaries, and more. In addition, we cover how JWU Providence ranks in comparison to other schools with culinary arts programs.
Go directly to any of the following sections:
In College Factual's most recent rankings for the best schools for culinary arts majors, JWU Providence came in at #2. This puts it in the top 5% of the country in this field of study. It is also ranked #1 in Rhode Island.
| Ranking Type | Rank |
|---|---|
| Best Culinary Arts Associate Degree Schools | 2 |
| Best Culinary Arts Schools | 2 |
| Best Culinary Arts Bachelor’s Degree Schools | 2 |
During the 2021-2022 academic year, Johnson & Wales University - Providence handed out 159 bachelor's degrees in culinary arts. This is an increase of 49% over the previous year when 107 degrees were handed out.
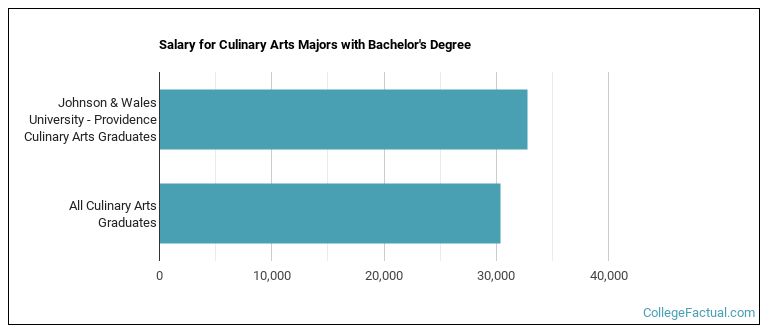
The median salary of culinary arts students who receive their bachelor's degree at JWU Providence is $32,775. This is higher than $30,409, which is the national median for all culinary arts bachelor's degree recipients.
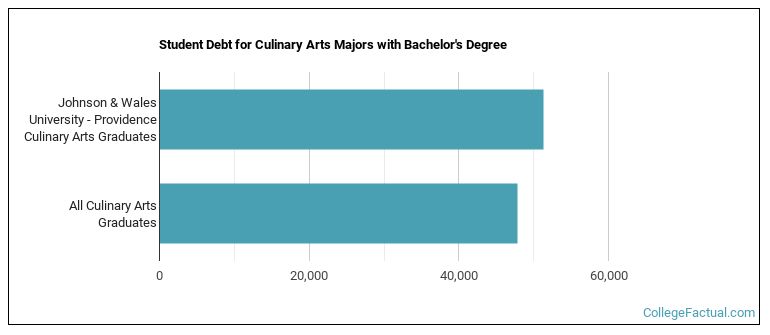
While getting their bachelor's degree at JWU Providence, culinary arts students borrow a median amount of $51,353 in student loans. This is higher than the the typical median of $47,895 for all culinary arts majors across the country.
The typical student loan payment of a bachelor's degree student from the culinary arts program at JWU Providence is $571 per month.
During the 2022-2023 academic year, part-time undergraduate students at JWU Providence paid an average of $1,105 per credit hour. No discount was available for in-state students. The average full-time tuition and fees for undergraduates are shown in the table below.
| In State | Out of State | |
|---|---|---|
| Tuition | $39,792 | $39,792 |
| Fees | $200 | $200 |
| Books and Supplies | $1,200 | $1,200 |
| On Campus Room and Board | $18,776 | $18,776 |
| On Campus Other Expenses | $1,758 | $1,758 |
Learn more about JWU Providence tuition and fees.
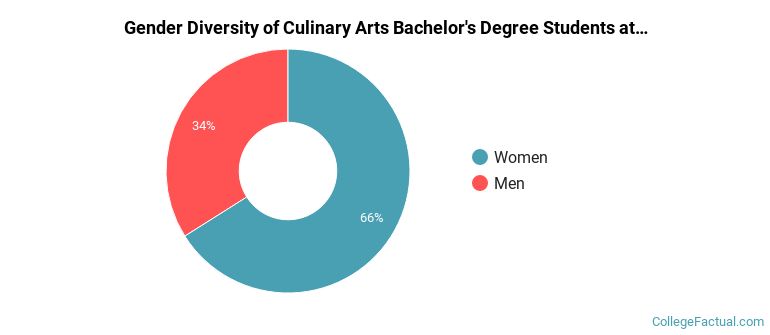
During the 2021-2022 academic year, 159 students graduated with a bachelor's degree in culinary arts from JWU Providence. About 34% were men and 66% were women.
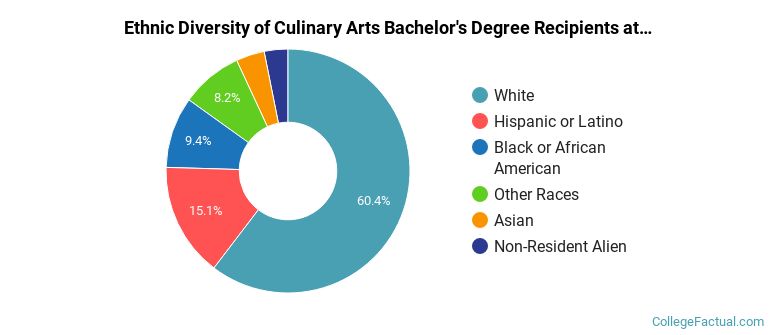
The majority of bachelor's degree recipients in this major at JWU Providence are white. In the most recent graduating class for which data is available, 60% of students fell into this category.
The following table and chart show the ethnic background for students who recently graduated from Johnson & Wales University - Providence with a bachelor's in culinary arts.
| Ethnic Background | Number of Students |
|---|---|
| Asian | 6 |
| Black or African American | 15 |
| Hispanic or Latino | 24 |
| White | 96 |
| Non-Resident Aliens | 5 |
| Other Races | 13 |
JWU Providence does not offer an online option for its culinary arts bachelor’s degree program at this time. To see if the school offers distance learning options in other areas, visit the JWU Providence Online Learning page.
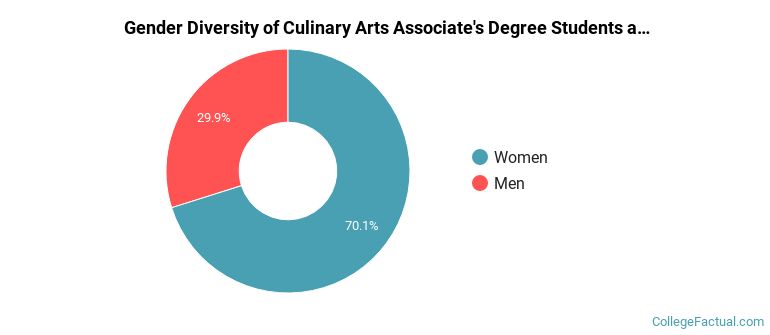
During the 2021-2022 academic year, 375 culinary arts majors earned their associate's degree from JWU Providence. Of these graduates, 30% were men and 70% were women.
The majority of the students with this major are white. About 52% of 2022 graduates were in this category.
The following table and chart show the ethnic background for students who recently graduated from Johnson & Wales University - Providence with a associate's in culinary arts.
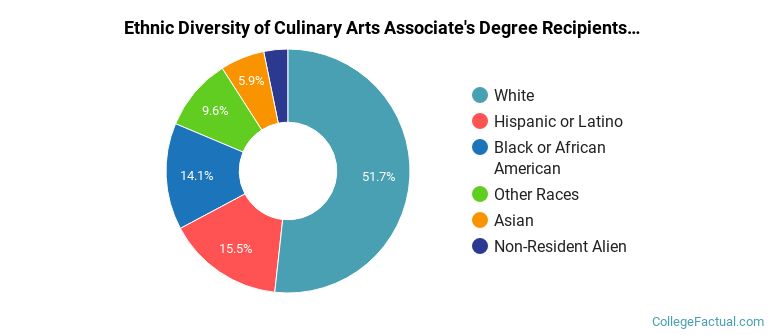
| Ethnic Background | Number of Students |
|---|---|
| Asian | 22 |
| Black or African American | 53 |
| Hispanic or Latino | 58 |
| White | 194 |
| Non-Resident Aliens | 12 |
| Other Races | 36 |
Take a look at the following statistics related to the make-up of the culinary arts majors at Johnson & Wales University - Providence.
More about our data sources and methodologies.