Explore the best ranked schools for the programs you are most interested in.
K College is ranked #1,124 out of 2,152 schools in the nation for overall quality on College Factual's 2025 Best Colleges list.
K College also holds the #30 spot on the Best Colleges in Michigan ranking.
The acceptance rate at Kalamazoo College is 79%. That's higher than the rate at many schools, but still low enough to be considered somewhat selective. If you want to get in, you'll need good grades and to be able to show that K College is a good fit for you.
About 38% of students accepted to K College submitted their SAT scores. When looking at the 25th through the 75th percentile, SAT Evidence-Based Reading and Writing scores ranged between 610 and 700. Math scores were between 590 and 670.
At K College, the student to faculty ratio is an excellent 10 to 1. That's much better than the national average of 15 to 1. This indicates that many classes will probably be small, and students will have ample opportunites to work closely with their professors and classmates.
Another measure that is often used to estimate how much access students will have to their professors is how many faculty members are full-time. The idea here is that part-time faculty tend to spend less time on campus, so they may not be as available to students as full-timers.
The full-time faculty percentage at Kalamazoo College is 79%. This is higher than the national average of 47%.
Kalamazoo College has a freshmen retention rate of 86%. That's a good sign that full-time students like the school and their professors enough to want to stick around for another year. It's also a sign that the admissions team did a good job in choosing applicants who were a good fit for the school.
Students are considered to have graduated on time if they finish their studies within four years. At K College the on-time graduation rate of first-time, full-time students is 72%. That is great when compared to the national average of 33.3%
Find out more about the retention and graduation rates at Kalamazoo College.
During the 2017-2018 academic year, there were 1,451 undergraduates at K College with 1,426 being full-time and 25 being part-time.
| $0-30 K | $30K-48K | $48-75 | $75-110K | $110K + |
|---|---|---|---|---|
| $17,208 | $15,134 | $22,121 | $26,343 | $31,814 |
The net price is calculated by adding tuition, room, board and other costs and subtracting financial aid.Note that the net price is typically less than the published for a school. For more information on the sticker price of K College, see our tuition and fees and room and board pages.
It's not uncommon for college students to take out loans to pay for school. In fact, almost 66% of students nationwide depend at least partially on loans. At K College, approximately 49% of students took out student loans averaging $7,426 a year. That adds up to $29,704 over four years for those students.
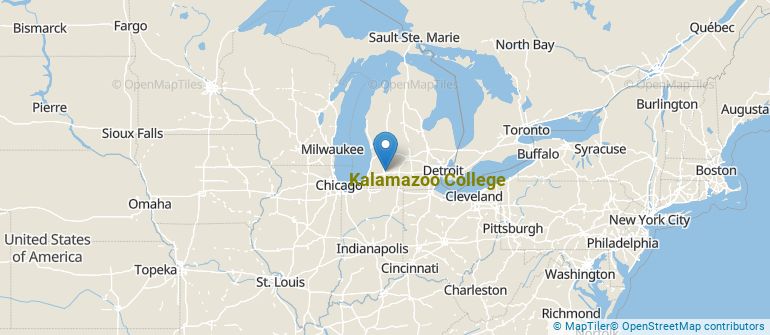
Get more details about the location of Kalamazoo College.
Contact details for K College are given below.
| Contact Details | |
|---|---|
| Address: | 1200 Academy St, Kalamazoo, MI 49006-3295 |
| Phone: | 269-337-7000 |
| Website: | https://www.kzoo.edu/ |
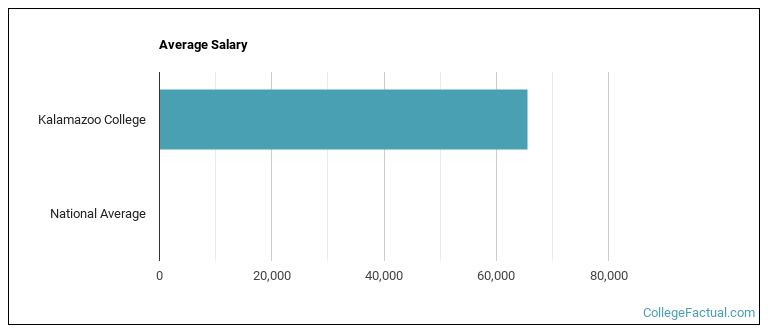
| Most Popular Majors | Bachelor’s Degrees | Average Salary of Graduates |
|---|---|---|
| General Biology | 62 | $24,211 |
| General Business/Commerce | 44 | $47,481 |
| General Psychology | 40 | $26,952 |
| Chemistry | 32 | $39,940 |
| General English Literature | 28 | $24,329 |
| Computer Information Systems | 22 | $72,008 |
| Romance Languages | 20 | NA |
| Economics | 20 | $42,508 |
| Mathematics | 17 | NA |
| Political Science & Government | 17 | $30,494 |
If you’re considering Kalamazoo College, here are some more schools you may be interested in knowing more about.
Curious on how these schools stack up against K College? Pit them head to head with College Combat, our free interactive tool that lets you compare college on the features that matter most to you!
Footnotes
*The racial-ethnic minorities count is calculated by taking the total number of students and subtracting white students, international students, and students whose race/ethnicity was unknown. This number is then divided by the total number of students at the school to obtain the racial-ethnic minorities percentage.
References
More about our data sources and methodologies.