Here, you'll find out more about the major, including such details as the number of graduates, what degree levels are offered, ethnicity of students, average salaries, and more. Also, learn how K -State ranks among other schools offering degrees in ce.
Go directly to any of the following sections:
The bachelor's program at K -State was ranked #106 on College Factual's Best Schools for ce list. It is also ranked #1 in Kansas.
| Ranking Type | Rank |
|---|---|
| Best Computer Engineering Bachelor’s Degree Schools | 103 |
| Best Computer Engineering Schools | 106 |
During the 2021-2022 academic year, Kansas State University handed out 30 bachelor's degrees in computer engineering. This is an increase of 3% over the previous year when 29 degrees were handed out.
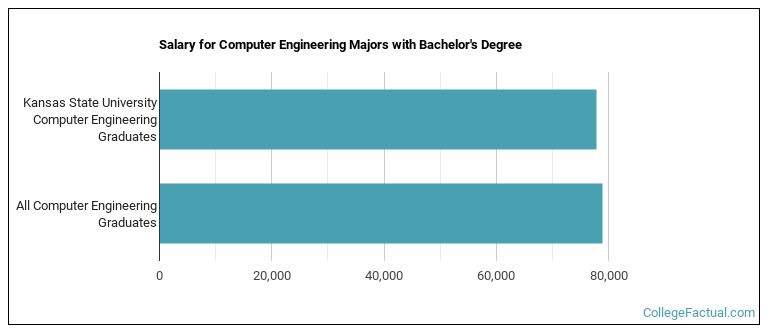
The median salary of ce students who receive their bachelor's degree at K -State is $77,938. This is less than $78,964, which is the national median of all ce majors in the nation who earn bachelor's degrees.
Out-of-state part-time undergraduates at K -State paid an average of $895 per credit hour in 2022-2023. The average for in-state students was $332 per credit hour. The following table shows the average full-time tuition and fees for undergraduates.
| In State | Out of State | |
|---|---|---|
| Tuition | $9,964 | $26,838 |
| Fees | $978 | $978 |
| Books and Supplies | $1,056 | $1,056 |
| On Campus Room and Board | $12,020 | $12,020 |
| On Campus Other Expenses | $5,268 | $5,268 |
Learn more about K -State tuition and fees.
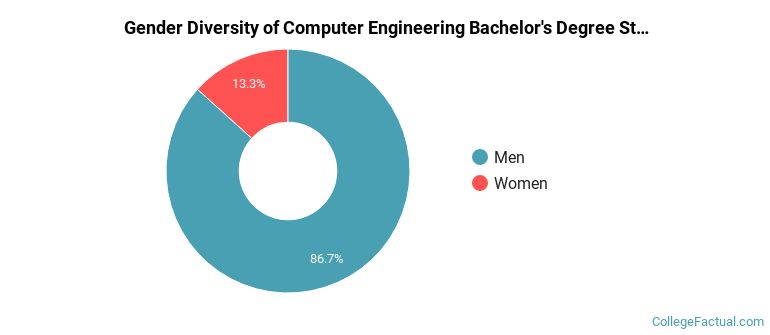
During the 2021-2022 academic year, 30 students graduated with a bachelor's degree in ce from K -State. About 87% were men and 13% were women.
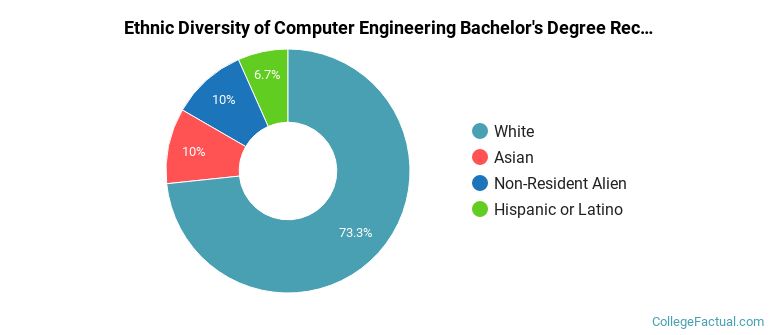
The majority of the students with this major are white. About 73% of 2022 graduates were in this category.
The following table and chart show the ethnic background for students who recently graduated from Kansas State University with a bachelor's in ce.
| Ethnic Background | Number of Students |
|---|---|
| Asian | 3 |
| Black or African American | 0 |
| Hispanic or Latino | 2 |
| White | 22 |
| Non-Resident Aliens | 3 |
| Other Races | 0 |
K -State does not offer an online option for its ce bachelor’s degree program at this time. To see if the school offers distance learning options in other areas, visit the K -State Online Learning page.
Take a look at the following statistics related to the make-up of the ce majors at Kansas State University.
| Related Major | Annual Graduates |
|---|---|
| Mechanical Engineering | 194 |
| Civil Engineering | 61 |
| Industrial Engineering | 58 |
| Electrical Engineering | 50 |
| Chemical Engineering | 46 |
More about our data sources and methodologies.