Go directly to any of the following sections:
The bachelor's program at Lackawanna College was ranked #1,320 on College Factual's Best Schools for health professions list. It is also ranked #59 in Pennsylvania.
| Ranking Type | Rank |
|---|---|
| Best Health Professions Associate Degree Schools | 690 |
| Best Health Professions Bachelor’s Degree Schools | 752 |
| Best Health Professions Schools | 1,320 |
During the 2021-2022 academic year, Lackawanna College handed out 21 bachelor's degrees in health professions. This is an increase of 5% over the previous year when 20 degrees were handed out.
Part-time undergraduates at Lackawanna College paid an average of $595 per credit hour in 2022-2023. This tuition was the same for both in-state and out-of-state students. The average full-time tuition and fees for undergraduates are shown in the table below.
| In State | Out of State | |
|---|---|---|
| Tuition | $17,020 | $17,020 |
| Fees | $930 | $930 |
| Books and Supplies | $1,500 | $1,500 |
| On Campus Room and Board | $12,110 | $12,110 |
| On Campus Other Expenses | $2,610 | $2,610 |
Learn more about Lackawanna College tuition and fees.
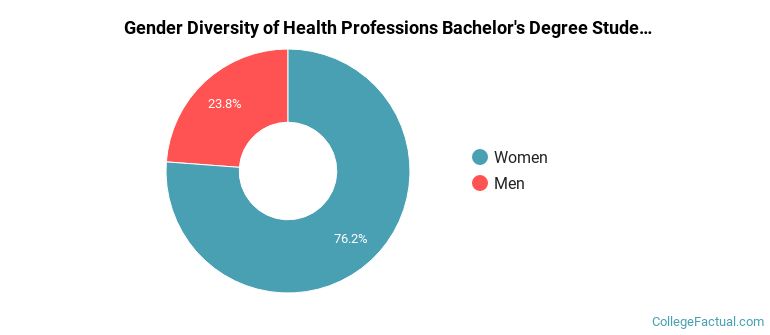
Of the 21 health professions students who graduated with a bachelor's degree in 2021-2022 from Lackawanna College, about 24% were men and 76% were women.
The following table and chart show the ethnic background for students who recently graduated from Lackawanna College with a bachelor's in health professions.
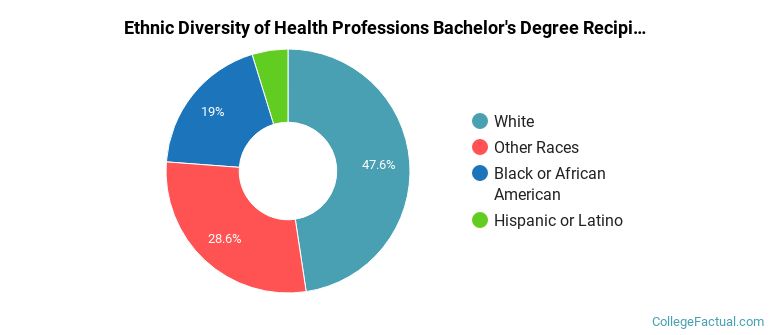
| Ethnic Background | Number of Students |
|---|---|
| Asian | 0 |
| Black or African American | 4 |
| Hispanic or Latino | 1 |
| White | 10 |
| Non-Resident Aliens | 0 |
| Other Races | 6 |
If you’re interested in online learning, you’re in luck. Lackawanna College does offer online classes in its health professions bachelor’s degree program. To see if the school offers distance learning options in other areas, visit the Lackawanna College Online Learning page.
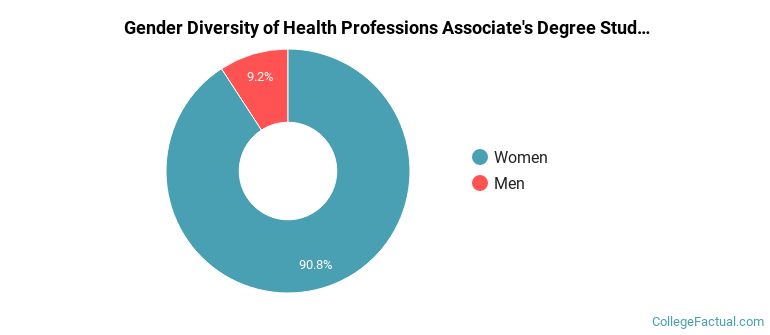
The health professions program at Lackawanna College awarded 98 associate's degrees in 2021-2022. About 9% of these degrees went to men with the other 91% going to women.
The majority of the students with this major are white. About 64% of 2022 graduates were in this category.
The following table and chart show the ethnic background for students who recently graduated from Lackawanna College with a associate's in health professions.
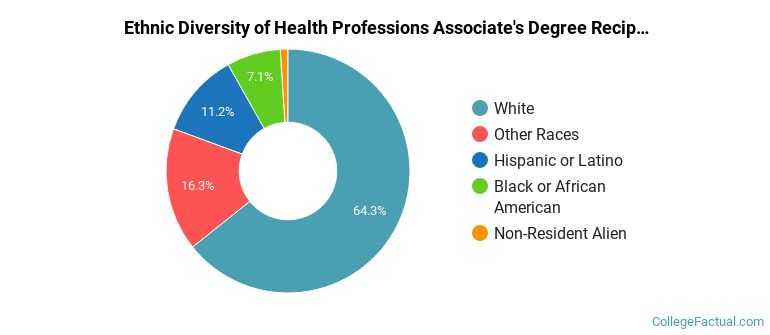
| Ethnic Background | Number of Students |
|---|---|
| Asian | 0 |
| Black or African American | 7 |
| Hispanic or Latino | 11 |
| White | 63 |
| Non-Resident Aliens | 1 |
| Other Races | 16 |
Take a look at the following statistics related to the make-up of the health professions majors at Lackawanna College.
Health Professions students may decide to major in one of the following focus areas. Individual majors may not be available for all degree levels.