Explore the best ranked schools for the programs you are most interested in.
Lake Forest is ranked #848 out of 2,152 schools in the nation for overall quality on College Factual's 2025 Best Colleges list.
Out of the 85 colleges in Illinois, Lake Forest is ranked at #33.
Lake Forest College has an acceptance rate of 60%, which means the school is serious about who it admits. Take your time in putting together a strong application that highlights why you are a good fit for Lake Forest.
About 19% of students accepted to Lake Forest submitted their SAT scores. When looking at the 25th through the 75th percentile, SAT Evidence-Based Reading and Writing scores ranged between 590 and 670. Math scores were between 563 and 670.
The student to faculty ratio is often used to measure the number of teaching resources that a college or university offers its students. The national average for this metric is 15 to 1, but at Lake Forest it is much better at 12 to 1. That's good news for students who want to interact more on a personal level with their teachers.
In addition to the student to faculty ratio, some people look at what percentage of faculty members are full-time as a sign of how much time professors will be able to spend with their students. This is because part-time teachers may not be be on campus as much as their full-time counterparts.
The full-time faculty percentage at Lake Forest College is 63%. This is higher than the national average of 47%.
The freshmen retention rate of 85% tells us that most first-year, full-time students like Lake Forest College enough to come back for another year. This is a fair bit higher than the national average of 68%. That's certainly something to check off in the good column about the school.
Students are considered to have graduated on time if they finish their studies within four years. At Lake Forest the on-time graduation rate of first-time, full-time students is 69%. That is great when compared to the national average of 33.3%
Find out more about the retention and graduation rates at Lake Forest College.
During the 2017-2018 academic year, there were 1,558 undergraduates at Lake Forest with 1,526 being full-time and 32 being part-time.
| $0-30 K | $30K-48K | $48-75 | $75-110K | $110K + |
|---|---|---|---|---|
| $17,663 | $21,431 | $21,904 | $28,404 | $33,850 |
The net price is calculated by adding tuition, room, board and other costs and subtracting financial aid.Note that the net price is typically less than the published for a school. For more information on the sticker price of Lake Forest, see our tuition and fees and room and board pages.
Almost 66% of college students who graduated with the class of 2018 took out student loans, but that percentage varies from school to school. At Lake Forest, approximately 72% of students took out student loans averaging $7,013 a year. That adds up to $28,052 over four years for those students.
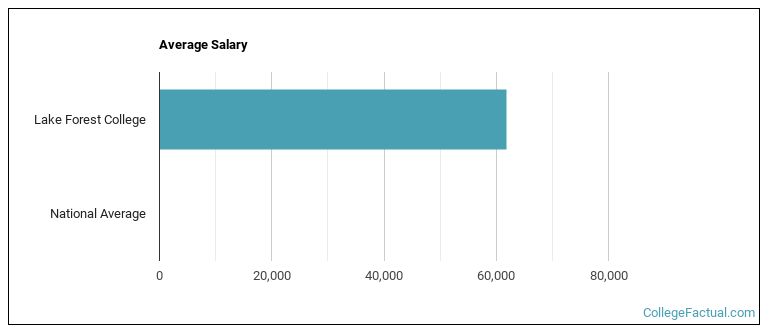
See which majors at Lake Forest College make the most money.
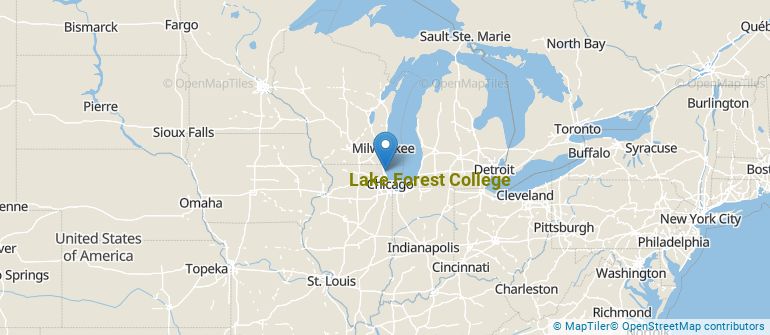
Get more details about the location of Lake Forest College.
Contact details for Lake Forest are given below.
| Contact Details | |
|---|---|
| Address: | 555 N Sheridan Road, Lake Forest, IL 60045-2338 |
| Phone: | 847-234-3100 |
| Website: | www.lakeforest.edu/ |
| Most Popular Majors | Bachelor’s Degrees | Average Salary of Graduates |
|---|---|---|
| General Business/Commerce | 53 | $44,283 |
| Child Development & Psychology | 41 | NA |
| General Biology | 40 | $33,380 |
| Economics | 36 | $53,529 |
| Finance & Financial Management | 30 | $61,264 |
| Communication & Media Studies | 30 | $42,835 |
| Neurobiology & Neurosciences | 29 | NA |
| General English Literature | 24 | $32,982 |
| Sociology & Anthropology | 20 | NA |
| Romance Languages | 16 | $35,622 |
Online learning options are becoming more and more popular at American colleges and universities. Online classes are great for students who have busy schedules or for those who just want to study on their own time.
In 2022-2023, 160 students took at least one online class at Lake Forest College. This is an increase from the 62 students who took online classes the previous year.
| Year | Took at Least One Online Class | Took All Classes Online |
|---|---|---|
| 2022-2023 | 160 | 0 |
| 2021-2022 | 62 | 0 |
| 2020-2021 | 1,583 | 1,583 |
| 2018-2019 | 0 | 0 |
Footnotes
*The racial-ethnic minorities count is calculated by taking the total number of students and subtracting white students, international students, and students whose race/ethnicity was unknown. This number is then divided by the total number of students at the school to obtain the racial-ethnic minorities percentage.
References
More about our data sources and methodologies.