Here, you'll find out more about the major, including such details as the number of graduates, what degree levels are offered, ethnicity of students, and more. In addition, we cover how LSC ranks in comparison to other schools with precision metal working programs.
Go directly to any of the following sections:
The precision metal working major at LSC is not ranked on College Factual’s Best Colleges and Universities for Precision Metal Working. This could be for a number of reasons, such as not having enough data on the major or school to make an accurate assessment of its quality.
Part-time undergraduates at LSC paid an average of $167 per credit hour in 2022-2023. This tuition was the same for both in-state and out-of-state students. The following table shows the average full-time tuition and fees for undergraduates.
| In State | Out of State | |
|---|---|---|
| Tuition | $4,996 | $4,996 |
| Fees | $789 | $789 |
| Books and Supplies | $1,500 | $1,500 |
Learn more about LSC tuition and fees.
LSC does not offer an online option for its precision metal working bachelor’s degree program at this time. To see if the school offers distance learning options in other areas, visit the LSC Online Learning page.
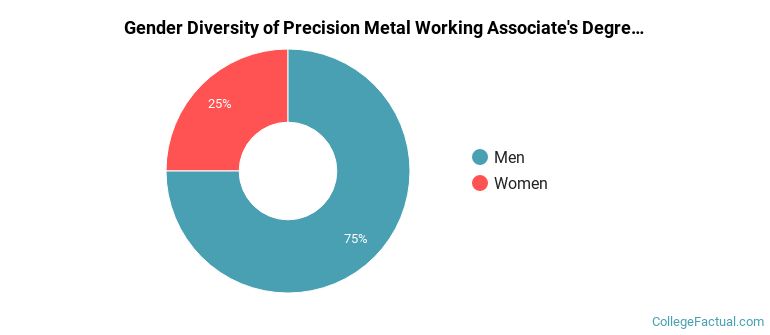
Of the 4 students who earned an associate's degree in Precision Metal Working from LSC in 2021-2022, 75% were men and 25% were women.
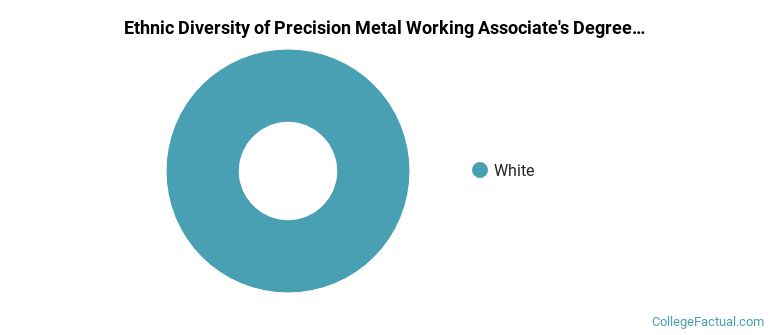
The majority of associate's degree recipients in this major at LSC are white. In the most recent graduating class for which data is available, 100% of students fell into this category.
The following table and chart show the ethnic background for students who recently graduated from Lake Superior College with a associate's in precision metal working.
| Ethnic Background | Number of Students |
|---|---|
| Asian | 0 |
| Black or African American | 0 |
| Hispanic or Latino | 0 |
| White | 4 |
| Non-Resident Aliens | 0 |
| Other Races | 0 |