Go directly to any of the following sections:
The parks & rec major at LWTech is not ranked on College Factual’s Best Colleges and Universities for Parks, Recreation, Leisure, & Fitness Studies. This could be for a number of reasons, such as not having enough data on the major or school to make an accurate assessment of its quality.
In 2022-2023, the average part-time undergraduate tuition at LWTech was $306 per credit hour for out-of-state students. The average for in-state students was $143 per credit hour. Information about average full-time undergraduate tuition and fees is shown in the table below.
| In State | Out of State | |
|---|---|---|
| Tuition | $3,195 | $8,548 |
| Fees | $1,961 | $2,469 |
| Books and Supplies | $1,221 | $1,221 |
Learn more about LWTech tuition and fees.
Online degrees for the LWTech parks & rec bachelor’s degree program are not available at this time. To see if the school offers distance learning options in other areas, visit the LWTech Online Learning page.
Of the 3 students who graduated with a Associate’s in parks & rec from LWTech in 2022, 33% were men and 67% were women.

The majority of associate's degree recipients in this major at LWTech are white. In the most recent graduating class for which data is available, 67% of students fell into this category.
The following table and chart show the ethnic background for students who recently graduated from Lake Washington Institute of Technology with a associate's in parks & rec.
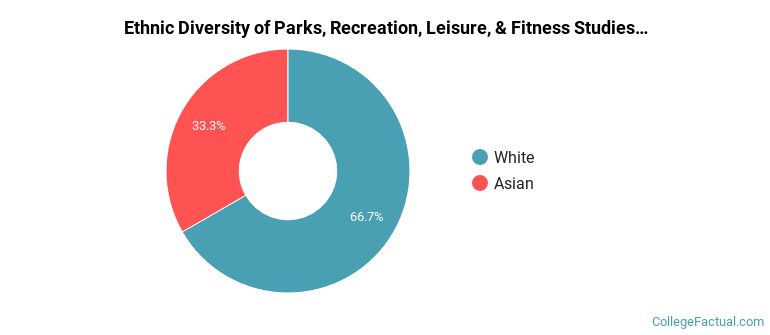
| Ethnic Background | Number of Students |
|---|---|
| Asian | 1 |
| Black or African American | 0 |
| Hispanic or Latino | 0 |
| White | 2 |
| Non-Resident Aliens | 0 |
| Other Races | 0 |
Parks, Recreation, Leisure, & Fitness Studies students may decide to major in one of the following focus areas. Individual majors may not be available for all degree levels.
| Major | Annual Graduates |
|---|---|
| Health & Physical Education | 3 |
| Related Major | Annual Graduates |
|---|---|
| Public Administration & Social Service | 24 |
View All Parks, Recreation, Leisure, & Fitness Studies Related Majors >