Here is an overview of this program at Lane Community College. Degrees are awarded at the Associate’s level. It ranks as high as #5 out of 16 schools (Associate’s level) by College Factual. Jump to any of the following sections:
By College Factual’s measure, Lane Community College highly for liberal arts general studies, coming in at #957 out of 1,506 schools nationally.
| Ranking | Rank |
|---|---|
| Best Liberal Arts General Studies Schools | 957 of 1,506 |
| Best Liberal Arts General Studies Schools in Oregon | 6 of 18 |
Here is each degree level available for liberal arts general studies at Lane Community College, along with how many graduates complete each level annually.
| Degree Level | Annual Graduates |
|---|---|
| Associate’s | 1,153 |
For the most recent IPEDS reporting year, Lane Community College conferred 1,153 associate’s degrees in liberal arts general studies.
Lane Community College ranks competitively among schools offering liberal arts general studies at the associate’s level. Its best result was #5 out of 16 schools by College Factual.
The full-time undergraduate tuition and fees are shown below.
| In State | Out of State | |
|---|---|---|
| Tuition | $4,536 | $12,078 |
| Fees | $1,000 | $1,000 |
Find out more about Lane Community College tuition and fees.
Among recent graduates, 48% of liberal arts general studies associate’s degrees went to men and 52% went to women.
 The majority of liberal arts general studies associate’s degree graduates at Lane Community College are White. Approximately 60% of graduates fell into this category.
The following table and chart show the ethnic background for students who recently graduated from Lane Community College with a associate’s in liberal arts general studies.
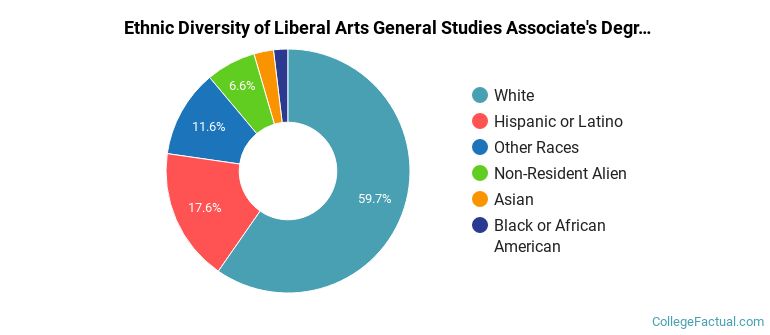
| Ethnic Background | Number of Students |
|---|---|
| Asian | 30 |
| Black or African American | 22 |
| Hispanic or Latino | 203 |
| White | 688 |
| Non-Resident Aliens | 76 |
| Other Races | 134 |
Lane Community College awarded 652 associate’s degrees in general studies in the most recent reporting year — 54% to women and 46% to men. Most of these graduates identified as White (61%).
Lane Community College conferred 501 associate’s completions in liberal arts and sciences/liberal studies in the latest year of data — 49% to women and 51% to men. The most common background among these graduates was White (58%).
More about our data sources and methodologies.