We've pulled together some essential information you should know about the program, including how many students graduate each year, the ethnic diversity of these students, and more. We've also included details on how LCCC ranks compared to other colleges offering a major in medical assisting.
Jump to any of the following sections:
The bachelor's program at LCCC was ranked #233 on College Factual's Best Schools for medical assisting list.
Out-of-state part-time undergraduates at LCCC paid an average of $315 per credit hour in 2022-2023. The average for in-state students was $105 per credit hour. The following table shows the average full-time tuition and fees for undergraduates.
| In State | Out of State | |
|---|---|---|
| Tuition | $3,150 | $9,450 |
| Fees | $1,463 | $1,463 |
| Books and Supplies | $1,200 | $1,200 |
| On Campus Room and Board | $9,372 | $9,372 |
| On Campus Other Expenses | $2,300 | $2,300 |
Learn more about LCCC tuition and fees.
LCCC does not offer an online option for its medical assisting bachelor’s degree program at this time. To see if the school offers distance learning options in other areas, visit the LCCC Online Learning page.
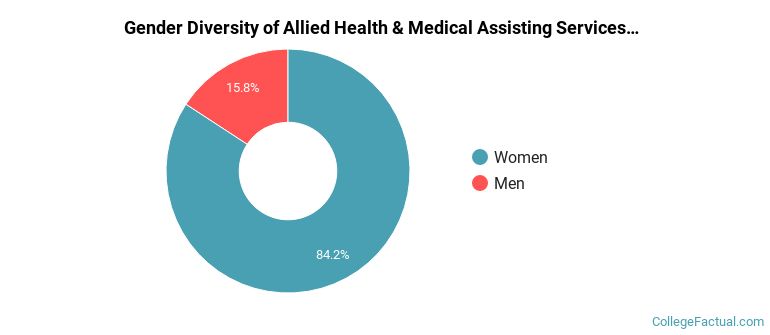
Of the 19 students who graduated with a Associate’s in medical assisting from LCCC in 2022, 16% were men and 84% were women.
The majority of associate's degree recipients in this major at LCCC are white. In the most recent graduating class for which data is available, 74% of students fell into this category.
The following table and chart show the ethnic background for students who recently graduated from Laramie County Community College with a associate's in medical assisting.
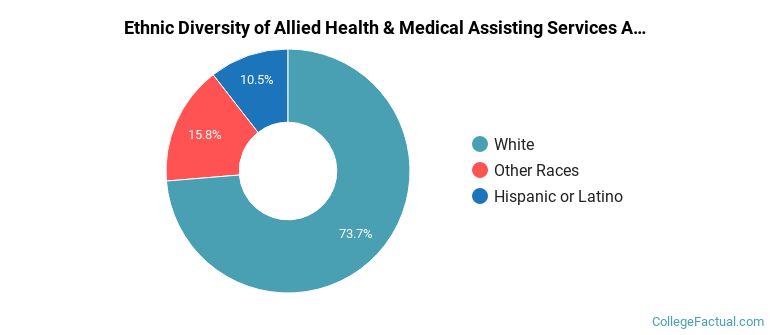
| Ethnic Background | Number of Students |
|---|---|
| Asian | 0 |
| Black or African American | 0 |
| Hispanic or Latino | 2 |
| White | 14 |
| Non-Resident Aliens | 0 |
| Other Races | 3 |
| Related Major | Annual Graduates |
|---|---|
| Nursing | 56 |
| Allied Health Professions | 51 |
| Health & Medical Administrative Services | 40 |
| Practical Nursing & Nursing Assistants | 40 |
| Dental Support Services | 20 |
View All Allied Health & Medical Assisting Services Related Majors >