Go directly to any of the following sections:
The liberal arts / sciences & humanities major at Liberty University is not ranked on College Factual’s Best Colleges and Universities for Liberal Arts / Sciences & Humanities. This could be for a number of reasons, such as not having enough data on the major or school to make an accurate assessment of its quality.
During the 2021-2022 academic year, Liberty University handed out 41 bachelor's degrees in liberal arts / sciences & humanities. This is a decrease of 41% over the previous year when 69 degrees were handed out.
Learn about other programs related to Liberal Arts / Sciences & Humanities that might interest you.
Maximize your transfer credits and complete your bachelor's degree faster with this flexible online bachelor's from Southern New Hampshire University.
In 2022-2023, the average part-time undergraduate tuition at Liberty University was $382 per credit hour for both in-state and out-of-state students. Information about average full-time undergraduate tuition and fees is shown in the table below.
| In State | Out of State | |
|---|---|---|
| Tuition | $15,015 | $15,015 |
| Fees | $807 | $807 |
| Books and Supplies | $1,599 | $1,599 |
| On Campus Room and Board | $12,919 | $12,919 |
| On Campus Other Expenses | $6,940 | $6,940 |
Learn more about Liberty University tuition and fees.
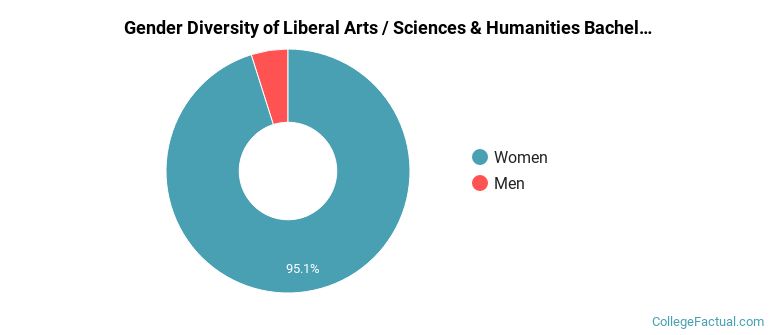
Of the 41 students who graduated with a Bachelor’s in liberal arts / sciences & humanities from Liberty University in 2022, 5% were men and 95% were women.
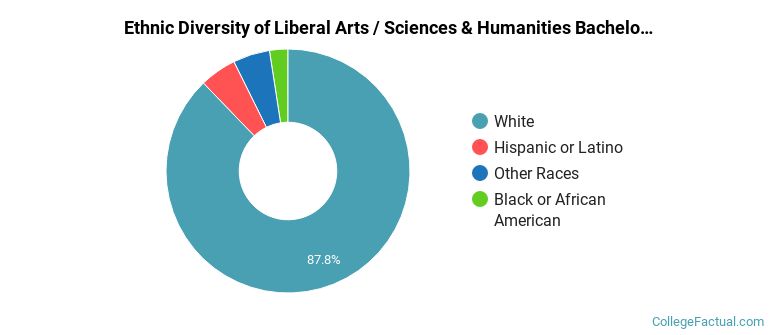
The majority of the students with this major are white. About 88% of 2022 graduates were in this category.
The following table and chart show the ethnic background for students who recently graduated from Liberty University with a bachelor's in liberal arts / sciences & humanities.
| Ethnic Background | Number of Students |
|---|---|
| Asian | 0 |
| Black or African American | 1 |
| Hispanic or Latino | 2 |
| White | 36 |
| Non-Resident Aliens | 0 |
| Other Races | 2 |
Online degrees for the Liberty University liberal arts / sciences & humanities bachelor’s degree program are not available at this time. To see if the school offers distance learning options in other areas, visit the Liberty University Online Learning page.
Take a look at the following statistics related to the make-up of the liberal arts / sciences & humanities majors at Liberty University.
Liberal Arts / Sciences & Humanities students may decide to major in one of the following focus areas. Individual majors may not be available for all degree levels.
| Major | Annual Graduates |
|---|---|
| Liberal Arts General Studies | 41 |
| Related Major | Annual Graduates |
|---|---|
| Theology & Religious Vocations | 2,369 |
| Philosophy & Religious Studies | 769 |
| Communication & Journalism | 507 |
| History | 447 |
| Social Sciences | 374 |
View All Liberal Arts / Sciences & Humanities Related Majors >
More about our data sources and methodologies.
