Lindenwood University total enrollment is approximately 7,382 students. 4,199 are undergraduates and 743 are graduate students.
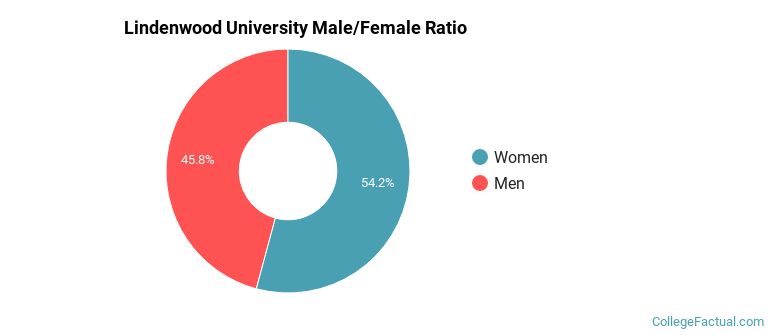
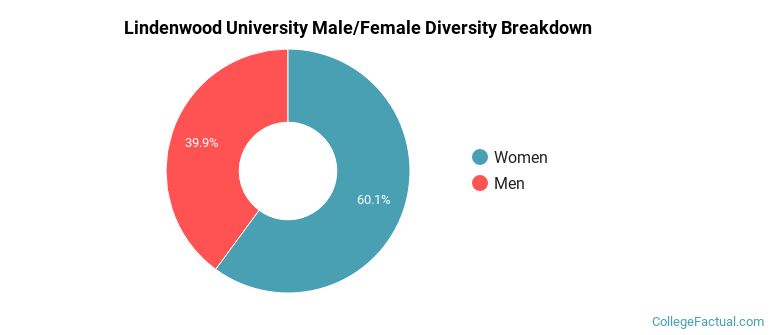
Male/Female Breakdown of Undergraduates
The full-time Lindenwood University undergraduate population is made up of 56% women, and 44% men.
For the gender breakdown for all students, go here.
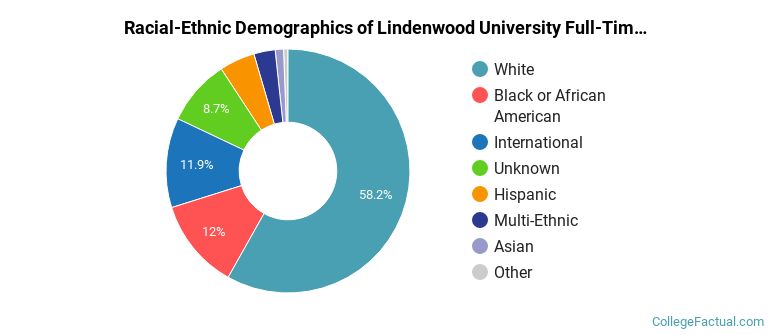
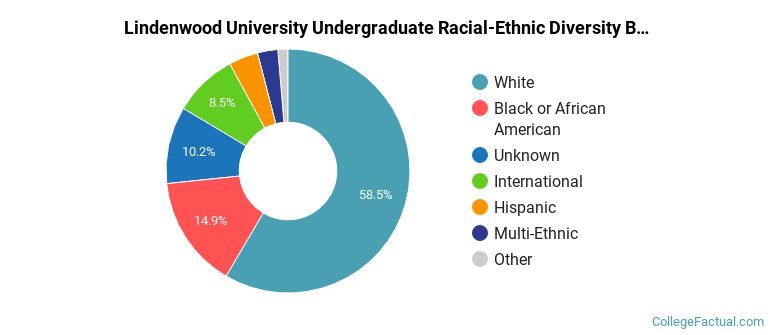
Lindenwood University Racial/Ethnic Breakdown of Undergraduates
| Race/Ethnicity | Number |
|---|---|
| White | 2,541 |
| Black or African American | 534 |
| International | 427 |
| Unknown | 272 |
| Hispanic | 203 |
| Multi-Ethnic | 123 |
| Asian | 49 |
| Native Hawaiian or Pacific Islander | 32 |
See racial/ethnic breakdown for all students.
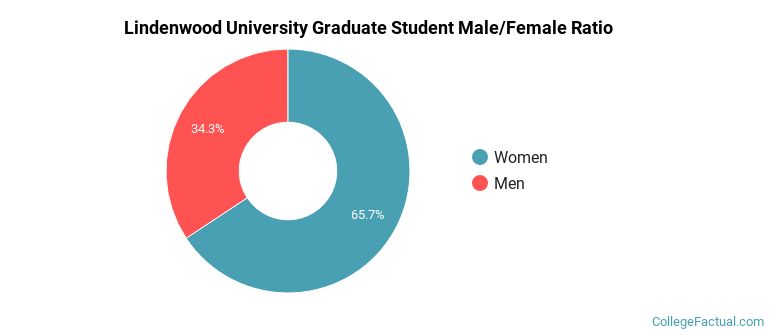
Male/Female Breakdown of Graduate Students
About 67% of full-time grad students are women, and 33% men.
For the gender breakdown for all students, go here.
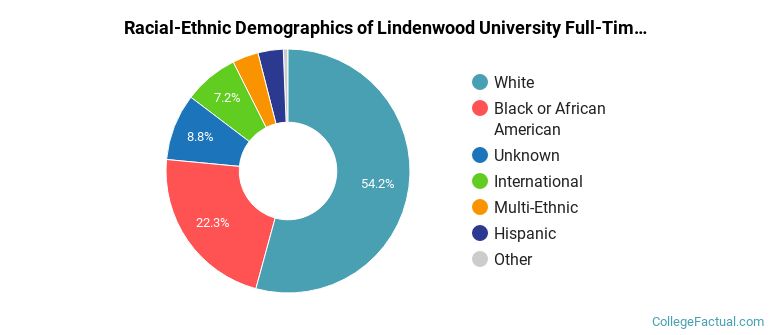
Lindenwood University Racial-Ethnic Breakdown of Graduate Students
| Race/Ethnicity | Number |
|---|---|
| White | 461 |
| Black or African American | 135 |
| Unknown | 43 |
| International | 34 |
| Multi-Ethnic | 31 |
| Hispanic | 26 |
| Asian | 7 |
| Native Hawaiian or Pacific Islander | 3 |
See racial/ethnic breakdown for all students.
| Race/Ethnicity | Number |
|---|---|
| White | 4,464 |
| Black or African American | 1,174 |
| Unknown | 547 |
| International | 523 |
| Hispanic | 299 |
| Multi-Ethnic | 220 |
| Asian | 75 |
| Native Hawaiian or Pacific Islander | 43 |
There are approximately 4,507 female students and 2,875 male students at Lindenwood University.
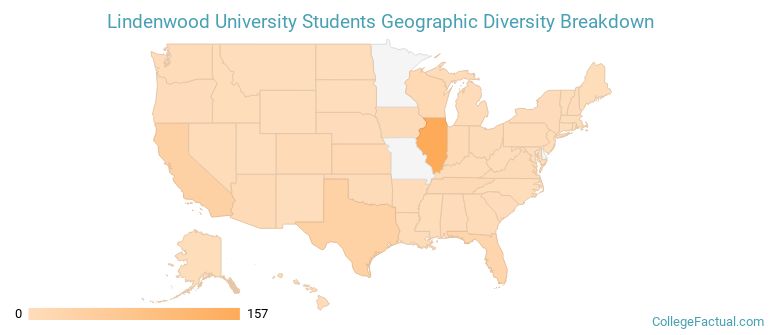
Lindenwood University ranks 250 out of 2,183 when it comes to geographic diversity.
48.55% of Lindenwood University students come from out of state, and 14.58% come from out of the country.
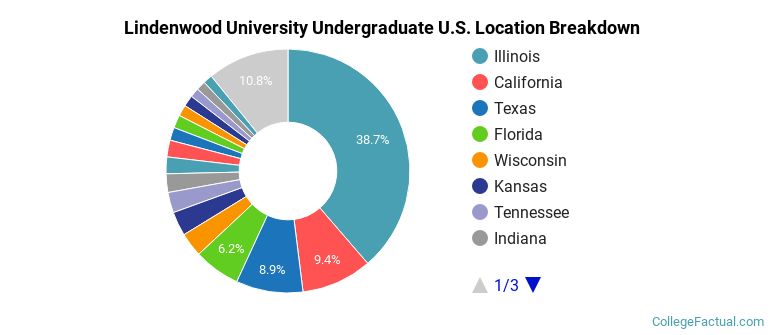
The undergraduate student body is split among 39 states (may include Washington D.C.). Click on the map for more detail.
| State | Amount |
|---|---|
| Illinois | 157 |
| California | 38 |
| Texas | 36 |
| Florida | 25 |
| Kansas | 13 |
Students from 108 countries are represented at this school, with the majority of the international students coming from Venezuela, Panama, and Canada.
Learn more about international students at Lindenwood University.
A traditional college student is defined as being between the ages of 18-21. At Lindenwood University, 33.53% of students fall into that category, compared to the national average of 60%.
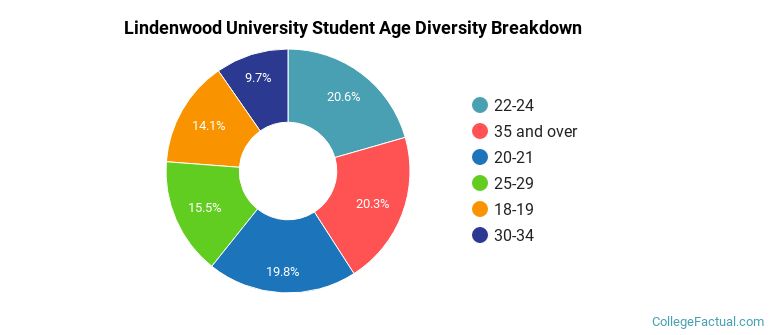
| Student Age Group | Amount |
|---|---|
| 22-24 | 2,035 |
| 35 and over | 2,014 |
| 20-21 | 1,963 |
| 25-29 | 1,532 |
| 18-19 | 1,398 |
| 30-34 | 957 |
| Under 18 | 0 |
Footnotes
*The racial-ethnic minorities count is calculated by taking the total number of students and subtracting white students, international students, and students whose race/ethnicity was unknown. This number is then divided by the total number of students at the school to obtain the racial-ethnic minorities percentage.
References