Explore the best ranked schools for the programs you are most interested in.
Loras is ranked #1,216 out of 2,152 schools in the nation for overall quality on College Factual's 2025 Best Colleges list.
Out of the 37 colleges in Iowa, Loras is ranked at #29.
With an acceptance rate of 90%, Loras College is easier to get into than many other schools. But that doesn't mean you can slack off on your application. Make sure to treat this school like any other when submitting requested materials and documents.
The student to faculty ratio is often used to measure the number of teaching resources that a college or university offers its students. The national average for this metric is 15 to 1, but at Loras it is much better at 12 to 1. That's good news for students who want to interact more on a personal level with their teachers.
When estimating how much access students will have to their teachers, some people like to look at what percentage of faculty members are full time. This is because part-time teachers may not have as much time to spend on campus as their full-time counterparts.
The full-time faculty percentage at Loras College is 73%. This is higher than the national average of 47%.
Loras College has a freshmen retention rate of 77%. That's a good sign that full-time students like the school and their professors enough to want to stick around for another year. It's also a sign that the admissions team did a good job in choosing applicants who were a good fit for the school.
The on-time graduation rate for someone pursuing a bachelor's degree is typically four years. This rate at Loras for first-time, full-time students is 64%, which is better than the national average of 33.3%.
Find out more about the retention and graduation rates at Loras College.
During the 2017-2018 academic year, there were 1,314 undergraduates at Loras with 1,214 being full-time and 100 being part-time.
| $0-30 K | $30K-48K | $48-75 | $75-110K | $110K + |
|---|---|---|---|---|
| $16,997 | $17,052 | $19,525 | $19,052 | $24,560 |
The net price is calculated by adding tuition, room, board and other costs and subtracting financial aid.Note that the net price is typically less than the published for a school. For more information on the sticker price of Loras, see our tuition and fees and room and board pages.
While almost two-thirds of students nationwide take out loans to pay for college, the percentage may be quite different for the school you plan on attending. At Loras, approximately 63% of students took out student loans averaging $8,092 a year. That adds up to $32,368 over four years for those students.
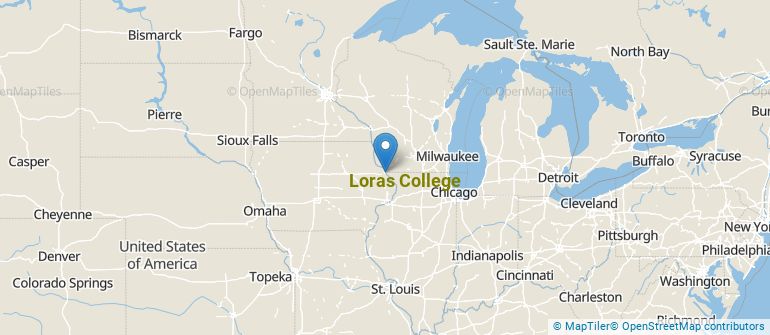
Get more details about the location of Loras College.
Contact details for Loras are given below.
| Contact Details | |
|---|---|
| Address: | 1450 Alta Vista, Dubuque, IA 52004-0178 |
| Phone: | 563-588-7100 |
| Website: | www.loras.edu/ |
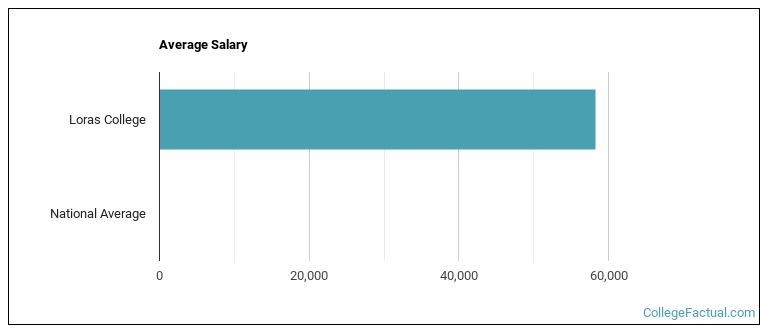
| Most Popular Majors | Bachelor’s Degrees | Average Salary of Graduates |
|---|---|---|
| Neurobiology & Neurosciences | 60 | NA |
| Health & Physical Education | 60 | $31,493 |
| Business Administration & Management | 35 | $41,810 |
| Teacher Education Grade Specific | 33 | $40,328 |
| General Psychology | 22 | $23,564 |
| Social Work | 21 | NA |
| Data Analytics | 18 | NA |
| Accounting | 17 | $61,147 |
| Finance & Financial Management | 17 | $59,434 |
| Marketing | 16 | $46,541 |
Online courses area a great option for busy, working students as well as for those who have scheduling conflicts and want to study on their own time. As time goes by, expect to see more and more online learning options become available.
In 2022-2023, 105 students took at least one online class at Loras College. This is a decrease from the 193 students who took online classes the previous year.
| Year | Took at Least One Online Class | Took All Classes Online |
|---|---|---|
| 2022-2023 | 105 | 31 |
| 2021-2022 | 193 | 14 |
| 2020-2021 | 897 | 18 |
| 2018-2019 | 67 | 20 |
Footnotes
*The racial-ethnic minorities count is calculated by taking the total number of students and subtracting white students, international students, and students whose race/ethnicity was unknown. This number is then divided by the total number of students at the school to obtain the racial-ethnic minorities percentage.
References
More about our data sources and methodologies.