Jump to any of the following sections:
The bachelor's program at Loyola Marymount was ranked #6 on College Factual's Best Schools for playwriting and screenwriting list. It is also ranked #2 in California.
During the 2020-2021 academic year, Loyola Marymount University handed out 60 bachelor's degrees in playwriting & screenwriting. Last year, the same number of degrees were handed out.
In 2021, 12 students received their master’s degree in playwriting and screenwriting from Loyola Marymount. This makes it the #11 most popular school for playwriting and screenwriting master’s degree candidates in the country.
Take a look at the following statistics related to the make-up of the playwriting and screenwriting majors at Loyola Marymount University.
During the 2020-2021 academic year, 60 playwriting and screenwriting majors earned their bachelor's degree from Loyola Marymount. Of these graduates, 47% were men and 53% were women.

The majority of bachelor's degree recipients in this major at Loyola Marymount are white. In the most recent graduating class for which data is available, 58% of students fell into this category.
The following table and chart show the ethnic background for students who recently graduated from Loyola Marymount University with a bachelor's in playwriting and screenwriting.
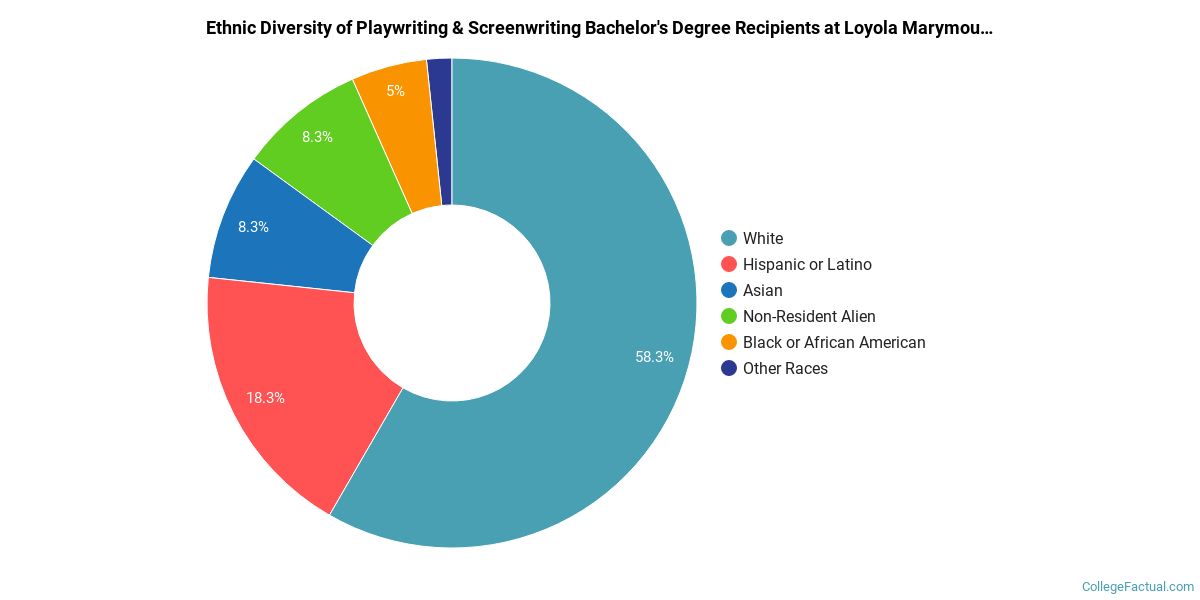
| Ethnic Background | Number of Students |
|---|---|
| Asian | 5 |
| Black or African American | 3 |
| Hispanic or Latino | 11 |
| White | 35 |
| Non-Resident Aliens | 5 |
| Other Races | 1 |
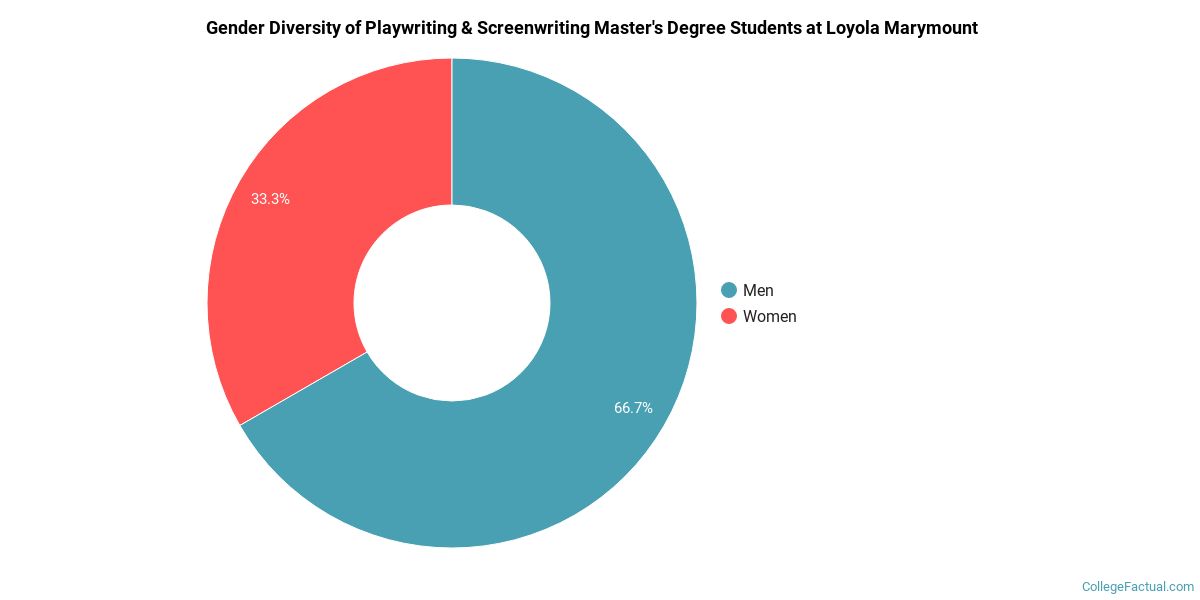
The playwriting and screenwriting program at Loyola Marymount awarded 12 master's degrees in 2020-2021. About 67% of these degrees went to men with the other 33% going to women.
The majority of the students with this major are white. About 58% of 2021 graduates were in this category.
The following table and chart show the ethnic background for students who recently graduated from Loyola Marymount University with a master's in playwriting and screenwriting.
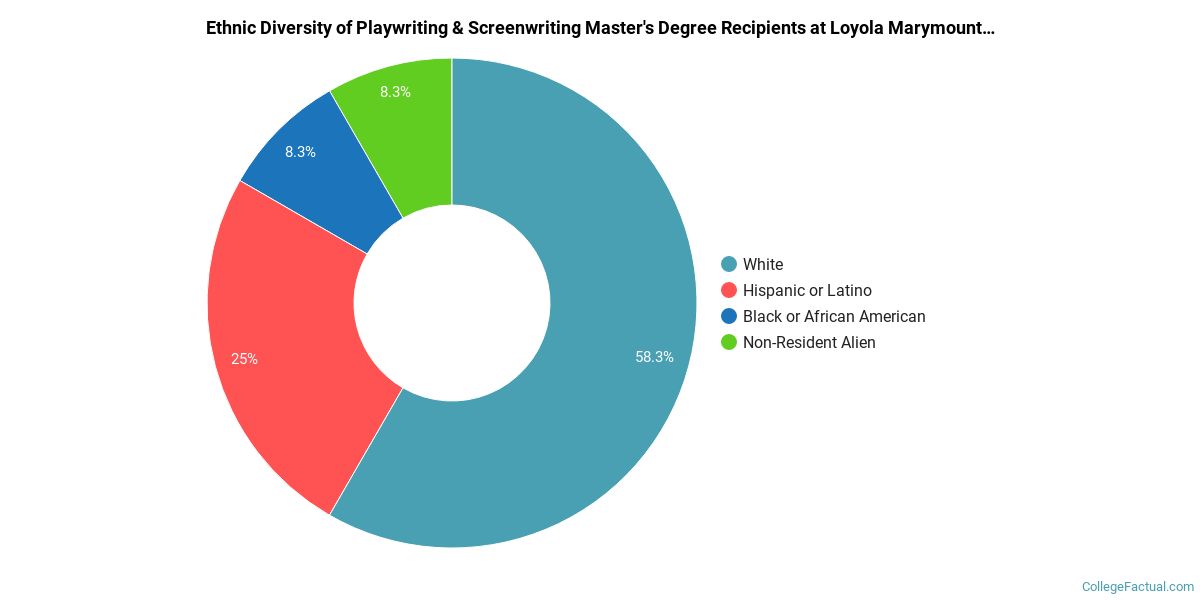
| Ethnic Background | Number of Students |
|---|---|
| Asian | 0 |
| Black or African American | 1 |
| Hispanic or Latino | 3 |
| White | 7 |
| Non-Resident Aliens | 1 |
| Other Races | 0 |
| Related Major | Annual Graduates |
|---|---|
| Theater Arts | 40 |
More about our data sources and methodologies.